Project Budget Template: Planned, Committed and Actual on One Sheet (2026)
A project budget earns trust in the gap between two questions: what did we plan to spend, and what have we signed up to spend? Most sheets track the first and skip the second, which is how a project discovers in month four that a $30,000 contractor agreement has been quietly eating the remaining budget since month one. The template below carries three money columns per line, planned, committed and actual, with variance and percent-used formulas doing the arithmetic.
The pre-filled sample is an $84,260 website replatform: nine budget lines across people, software and other direct costs, a 10 percent contingency row with one recorded draw, and a summary block showing the project 61 percent consumed. Real numbers because a budget template full of zeros cannot teach you where to look when your own project starts drifting.
Work the budget in the browser. No signup.
A slice of the sample budget you can edit right now. Type an invoice into an Actual cell and read the variance. Nothing you do here is saved or sent anywhere. Signing up turns it into a sheet with history on every cell.
=[Planned ($)]@row - [Actual ($)]@rowfills Variance ($)| Line Item | Planned ($) | Committed ($) | Actual ($) | Variance ($) | % Used | Notes |
|---|---|---|---|---|---|---|
| 600 | 95 | |||||
| 17,500 | 51 | |||||
| -400 | 106 | |||||
| 0 | 100 | |||||
| 1,800 | 50 | |||||
| 2,800 | 30 |
Sandbox only, edits don't persist. Want to keep your work? Start your 7-day free trial →
Three project budget templates, free to download
Every download began as a live Wisegrid sheet and left through the product exporter carrying the full sample project. Use them in Excel or anything else that opens .xlsx. The links are plain files with no form standing in front of them.
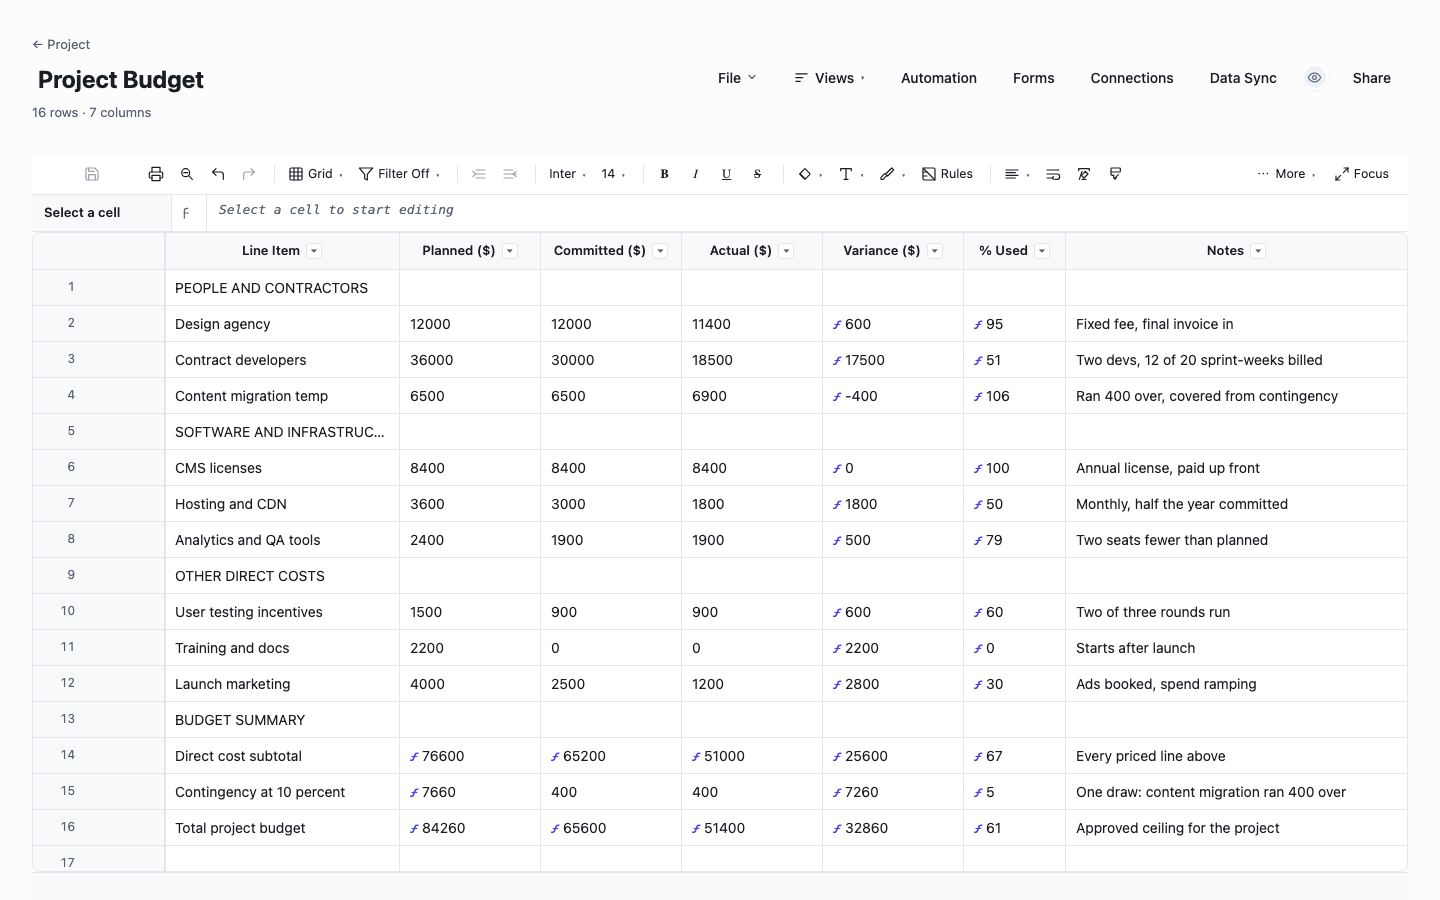
Project Budget
The full budget worksheet for a single project. Line items sit under category header rows, people, software and other direct costs, each carrying planned, committed and actual dollars with a variance formula and a percent-used formula alongside. The summary block totals the direct costs at $76,600, adds a computed 10 percent contingency row of $7,660 with its one recorded draw, and lands the $84,260 total at 61 percent consumed. Notes on each line say what the numbers mean, the habit that keeps a budget reviewable in six months.
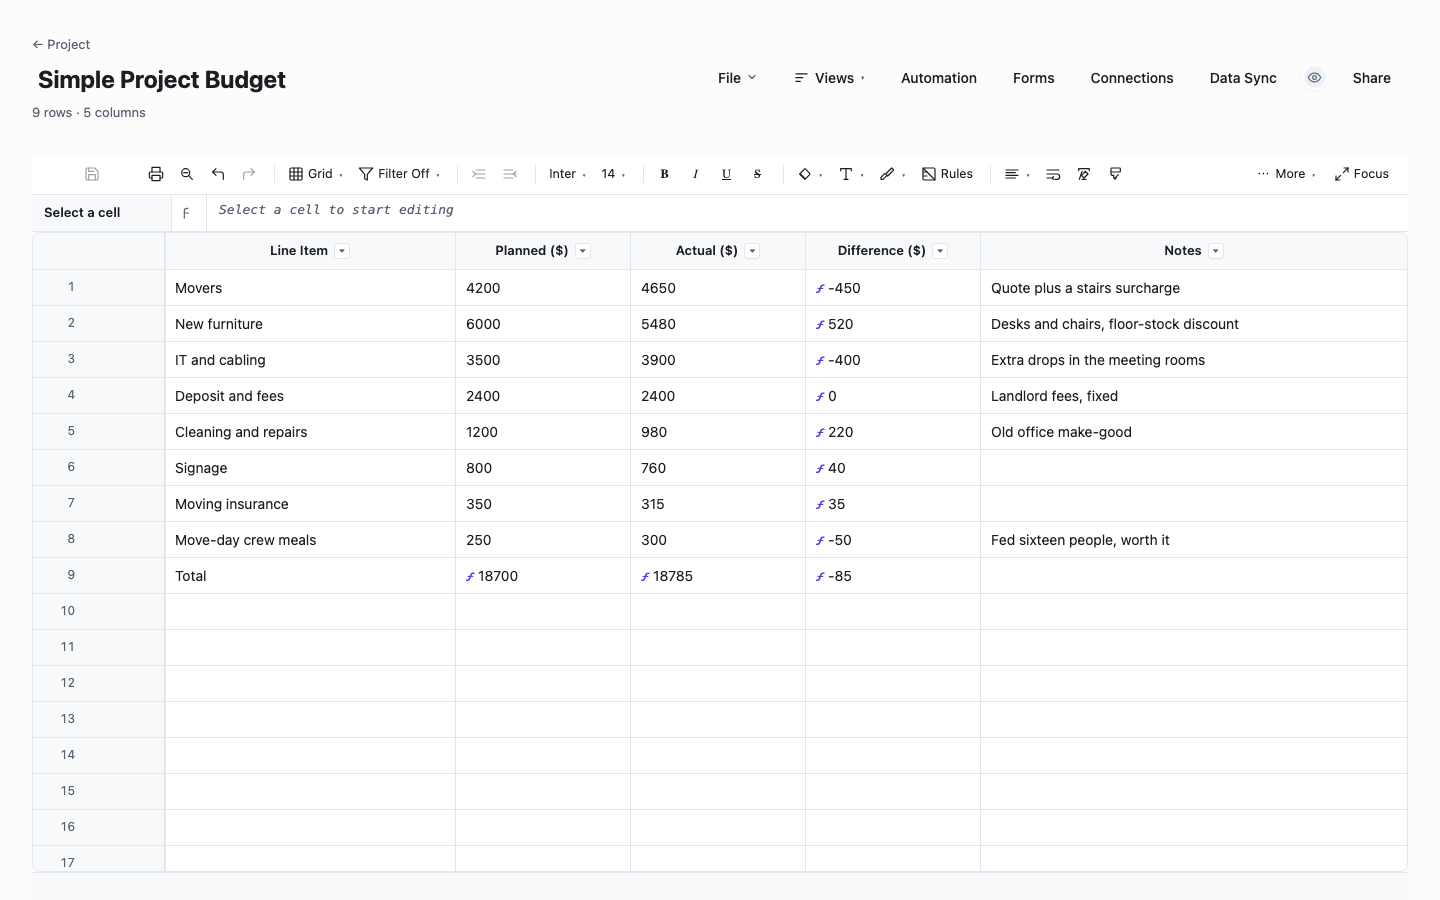
Simple Project Budget
Planned against actual and nothing else, for projects too small to justify commitment tracking. The sample is an office relocation with eight lines totaling $18,700 planned, and a Difference column that nets out to $85 over when the movers and cabling run past their quotes. Ten minutes to adapt. If you find yourself wanting a place to record signed contracts before the invoices arrive, that is the sign to move up to the full worksheet.
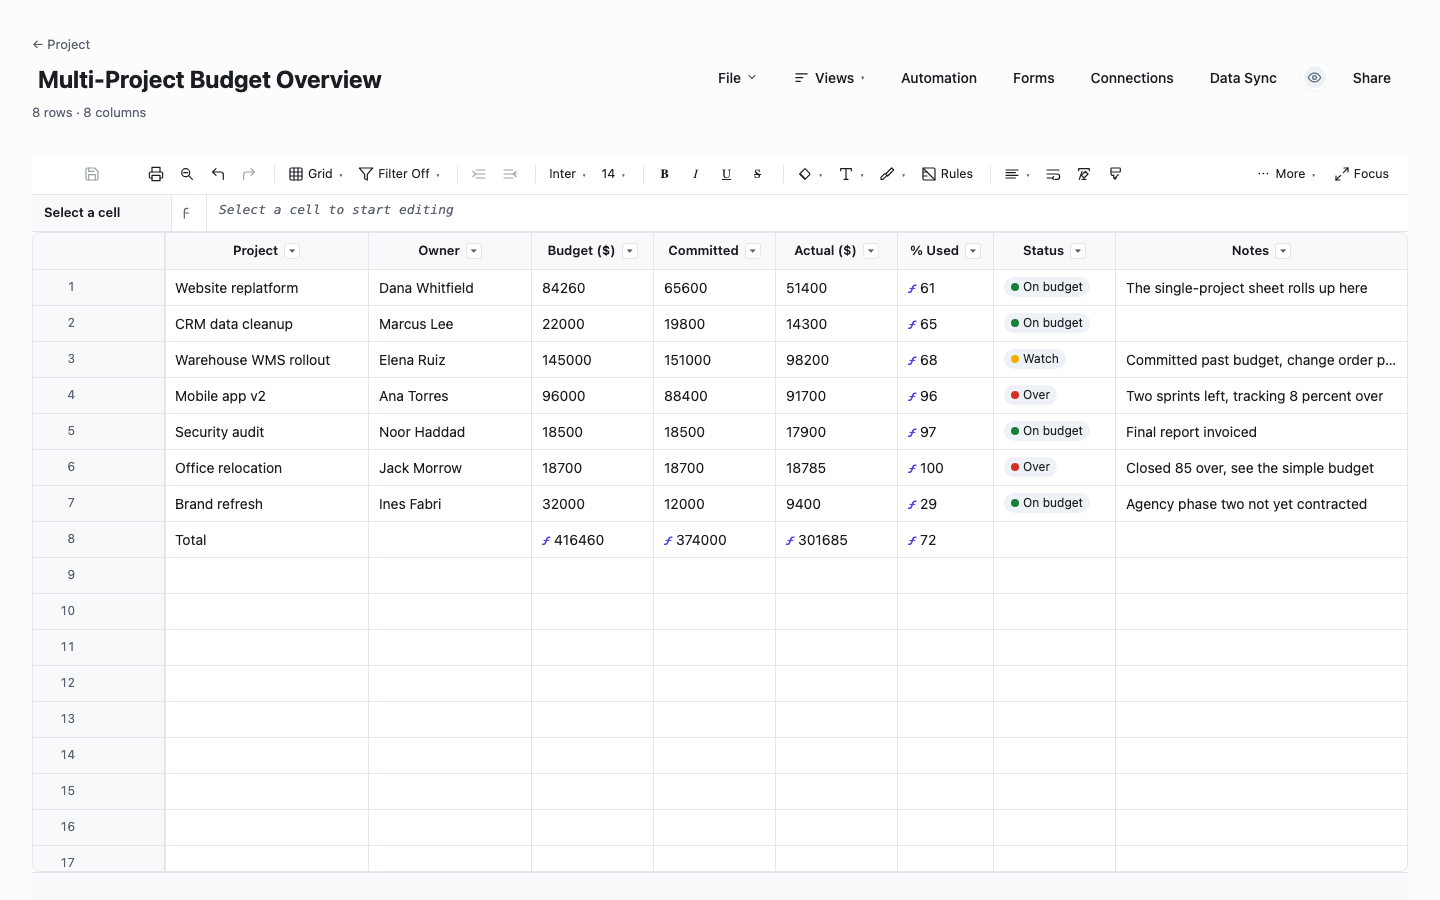
Multi-Project Budget Overview
One row per project for the person accountable for several at once. Budget, committed and actual per project, a computed percent-used column, and a status dropdown for the ten-second read: On budget, Watch or Over. The sample portfolio carries seven projects and $416,460 of approved budget at 72 percent consumed, including one project flagged Watch because its commitments have passed its budget while spend still looks calm. That flag is the whole point of the sheet.
How to build a project budget that survives contact with invoices
List every line item before you price anything
Walk the project phase by phase and write down everything that costs money: people, contractors, licenses, hosting, testing incentives, training, launch spend. Pricing comes second. Budgets fail more often from a forgotten line than a bad estimate, and the sample sheet keeps a Training and docs row at $2,200 even though nothing bills against it until after launch.
Price the people first, they dominate everything
On the sample project, people and contractors are $54,500 of $76,600 in direct costs, which is 71 percent. Get the day-rate-times-duration math right on those three lines and the whole budget is roughly right. Software and infrastructure add $14,400, the remaining direct lines $7,700, and no amount of precision there rescues a bad staffing estimate.
Track committed money, not just spent money
Committed means a signed contract or purchase order that has not fully billed yet. The sample dev line shows why the column exists: $36,000 planned, $30,000 committed, only $18,500 actually invoiced. A planned-vs-actual sheet reads that line as half the money still free. The committed column shows the truth, which is that most of it is already promised to someone.
Let formulas compute variance and percent used
Each line runs =[Planned ($)]@row - [Actual ($)]@row for variance and =ROUND([Actual ($)]@row / [Planned ($)]@row * 100, 0) for percent used. Hand-typed totals drift, and drifted totals get ignored. In Wisegrid the @row references recalculate as you type, so entering one invoice updates the line, the subtotal and the total in the same keystroke.
Give contingency its own visible row
The sample holds 10 percent of direct costs, $7,660, in a contingency row computed by formula rather than hidden as padding inside other lines. Padded lines get spent. A visible reserve gets managed. The row also records its draws: $400 went to cover the content migration running over, and the note says so, which is what makes the reserve auditable later.
Re-forecast monthly and escalate on thresholds
Update actuals and committed weekly from invoices, then once a month ask the harder question: at this burn, what does the final number look like? A line 5 percent over plan deserves a conversation. Ten percent deserves the sponsor. The variance column makes both thresholds visible early, while the fix is still cheap and the options are still open.
Planned, committed, actual: three numbers with different jobs
Planned is the estimate the project was approved on. Actual is what has been invoiced. Committed is the one most budgets skip: money contractually promised but not yet billed. The three tell different stories about the same line, and the gap between committed and actual is where surprises hide. On the sample sheet, $65,600 is committed against $51,400 of actuals, so $14,200 of invoices are already inbound no matter what the project does next.
The overview download applies the same logic across a portfolio. Its WMS rollout row is the cautionary example: spend sits at a comfortable 68 percent, while commitments have already passed the approved budget, so the row is flagged Watch with a change order pending. Actuals-only tracking would rate that project healthy for another two months, and by then the argument is about invoices instead of options.
Reading a project management budget template: variance and percent consumed
Variance is planned minus actual, so positive means under plan and negative means over. The convention matters less than consistency: pick one, write it in the header note, and the formal earned-value version, cost variance as earned value minus actual cost, is one click away in our cost variance calculator when a stakeholder wants the textbook number.
Percent consumed only means something next to percent complete. The sample project has consumed 61 percent of budget at roughly 70 percent complete, which is healthy. The same 61 percent at 40 percent complete would be an emergency wearing a calm face. Our earned value calculator below runs that comparison properly, CPI and SPI included. One honesty note on the downloads: Excel receives the formula columns as computed sample values, since each app rebuilds formulas in its own syntax. Open the sheet in Wisegrid and the chain stays live.
Frequently asked questions
How much contingency should a project budget include?
5 to 10 percent of direct costs for well-understood work, 15 to 20 percent when the project is novel or the requirements are still moving. The sample budget carries 10 percent, $7,660 on $76,600 of direct costs, as its own computed row. Keep it visible rather than padded into line items, because padding gets spent while a named reserve gets managed.
What is the difference between planned, committed and actual cost?
Planned is the approved estimate, committed is money promised under signed contracts or purchase orders that has not fully billed, and actual is what has been invoiced. The sample dev line reads $36,000 planned, $30,000 committed, $18,500 actual: a planned-vs-actual sheet calls half that money free, while the committed column shows it already spoken for.
How do I calculate budget variance?
Per line: planned minus actual, so $12,000 planned against $11,400 invoiced gives a variance of positive $600, under plan. Negative means over. A common working rule treats 5 percent over as a conversation and 10 percent as an escalation. The formal earned-value flavor, cost variance as earned value minus actual cost, is what our cost variance calculator computes if you need the textbook number.
What percent of budget should be consumed mid-project?
Roughly the same as the percent of work complete. The sample project sits at 61 percent consumed around 70 percent complete, which is comfortable. 61 percent consumed at 40 percent complete forecasts a serious overrun even though the absolute number looks fine. Percent consumed alone tells you nothing, which is why the earned value calculator pairs it with schedule progress.
What categories belong in a project budget?
Three cover most internal projects: people and contractors, software and infrastructure, and other direct costs, plus a contingency line. The sample splits $76,600 as $54,500 people, $14,400 software and $7,700 other, and that 71 percent people share is typical. Construction and client work usually add materials and permit categories, covered by our job costing template instead.
Does the project budget template work in Google Sheets?
Yes, by import: the downloads are .xlsx files, and File, Import in Google Sheets brings one in with the sample project, the category rows and all the computed numbers intact. We do not publish a native Sheets file. The formula columns arrive as values either way, so rebuild the two formulas from the how-to above, or use the live browser version where they already run.
When should a project draw from contingency?
Only for surprises inside the approved scope, and every draw gets logged. The sample records one: $400 to cover the content migration temp running over contract. Scope changes should never touch contingency, they get priced and approved as change orders, or the reserve quietly becomes a slush fund and is gone by the time a real surprise arrives.
Does the free project budget template work in Excel?
Yes. All three downloads are .xlsx files that open in Excel and the other spreadsheet apps, with the sample project filled in. The variance and percent-used columns arrive as the computed sample values, and the two-formula pattern above rebuilds in about a minute per column. Run the sheet in Wisegrid and the formulas stay live, with edit history per cell.
Run it live instead of in a file.
The downloads above are yours either way. In Wisegrid the same template becomes a working sheet with owner contacts, status dropdowns, reminders, and dashboards. 7-day free trial, no credit card required.