Feedback Triage Template: Tag Every Piece of 2026 Feedback Before It Goes Stale
A feedback triage template is the sheet between "we listen to our users" and actually doing it: one row per piece of feedback, with where it came from, which account said it, what kind of feedback it is, how much it matters, who owns the follow-up and whether that follow-up happened. The versions below ship pre-filled with a believable month of B2B product feedback, so you can see how the sheet is meant to run before you swap in your own inbox.
The part of triage everyone abandons is the tagging, because reading forty raw quotes and labeling each one is exactly the chore a busy week deletes first. So the full tracker hands that column to a formula: =CLASSIFY([Feedback]@row, "Bug, Feature request, Praise, Churn risk") reads each row and answers with one of your own labels. In Wisegrid that is a live formula, not an export to some other tool: paste a new quote in, and the Type cell fills itself.
Try the AI triage live. No signup.
This is an editable sheet with a working Type column, not a picture of one. Rewrite a Feedback cell and watch the formula re-tag the row. Edits stay in your tab and vanish when you leave. When you want a tracker that keeps, one click makes it yours.
=CLASSIFY([Feedback]@row, "Bug, Feature request, Praise, Churn risk")fills Type| Feedback | Source | Type | Severity | Status |
|---|---|---|---|---|
| BugAI | ||||
| PraiseAI | ||||
| Churn riskAI | ||||
| Feature requestAI | ||||
| BugAI | ||||
| Feature requestAI | ||||
| PraiseAI |
Sandbox only, edits don't persist. Want to keep your work? Start your 7-day free trial →
Three feedback triage templates, free to download
Every file here started life as a real sheet in Wisegrid and holds a month of realistic product feedback rather than a header row over blank space. Excel reads them fine, so does any .xlsx app, and no email is collected.
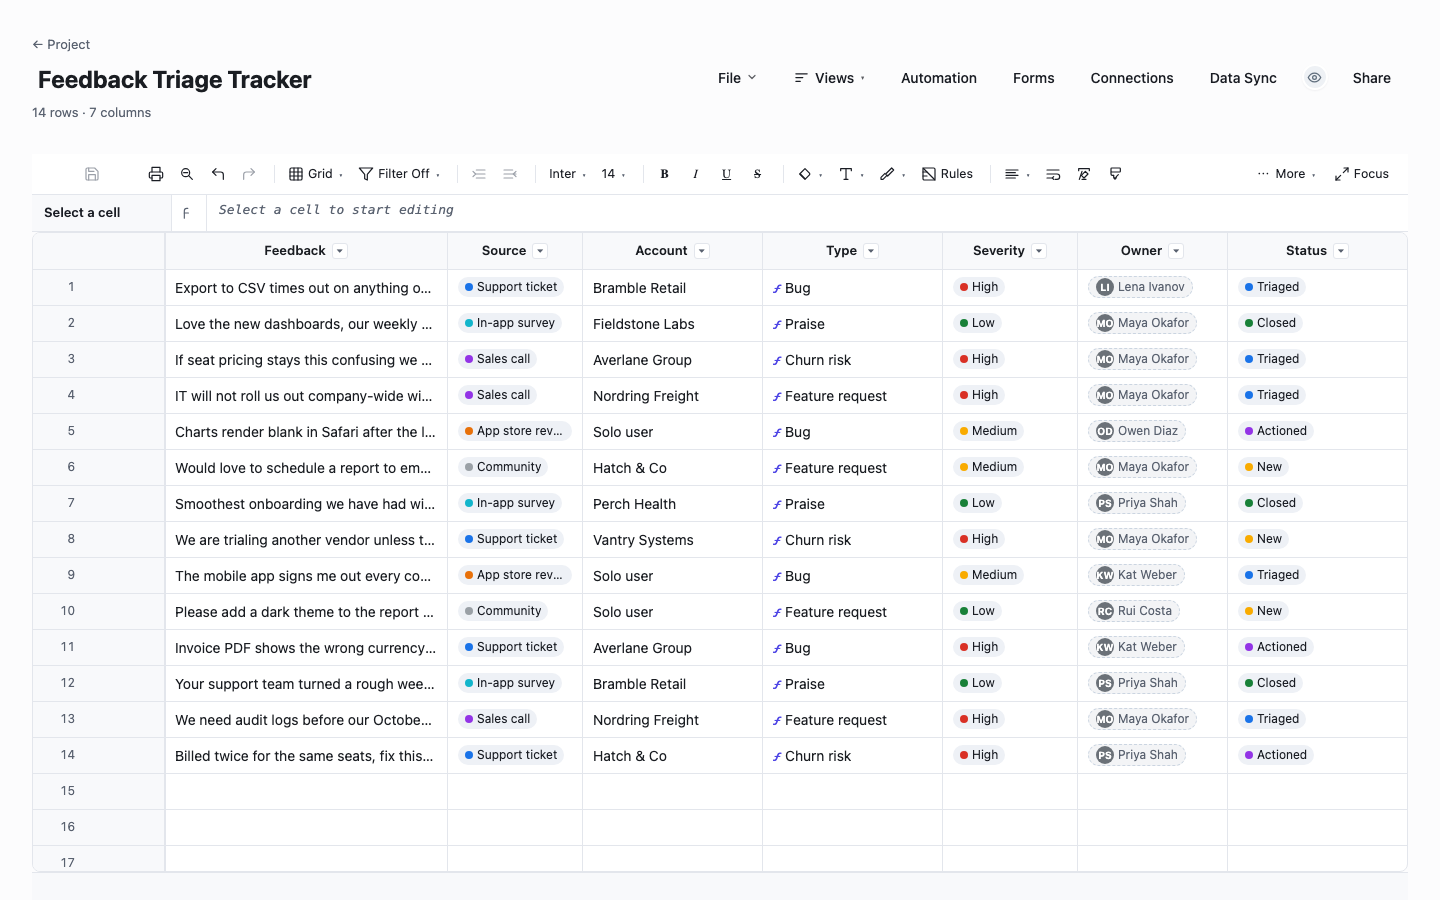
Feedback Triage Tracker
The full triage sheet, filled with fourteen pieces of feedback from support tickets, sales calls, in-app surveys, app store reviews and the community. Each row carries the quote verbatim, the account behind it, a severity, an owner and a triage status, and the Type column is a working AI formula: =CLASSIFY([Feedback]@row, "Bug, Feature request, Praise, Churn risk") tags each row against labels you can rewrite to match your own taxonomy. Start here if feedback arrives faster than one person can label it.
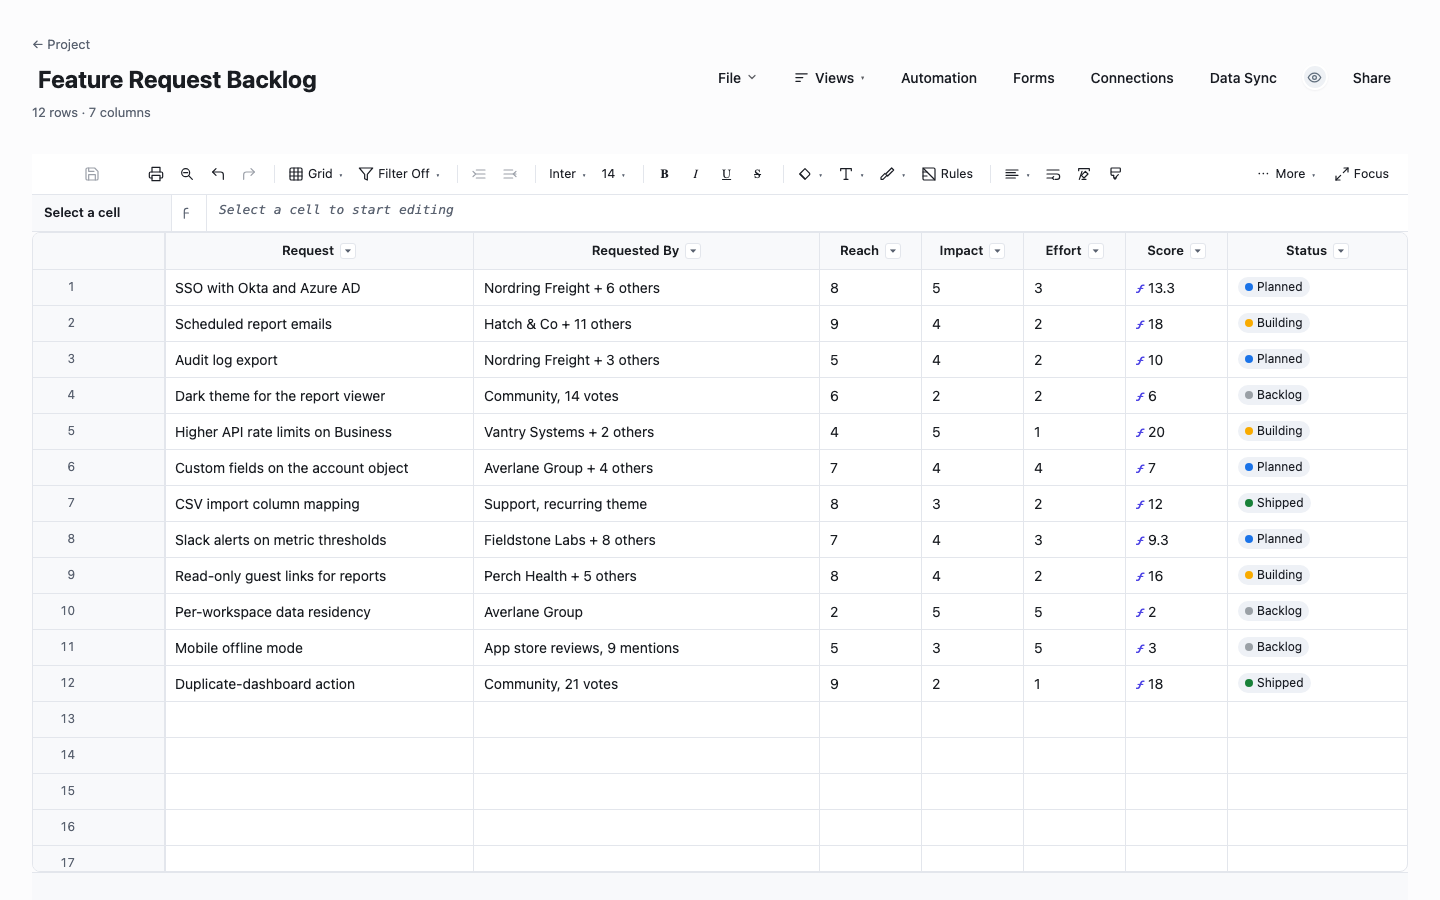
Feature Request Backlog
Where the "Feature request" rows go next: one row per distinct request with who asked for it, then reach, impact and effort scores and a Score column the sheet computes with =ROUND([Reach]@row * [Impact]@row / [Effort]@row, 1). The point of scoring in a sheet everyone can read is that the backlog order becomes arithmetic you can argue with, instead of a ranking that quietly tracks whoever asked loudest or most recently. Statuses run Backlog, Planned, Building, Shipped, so requesters can see motion.
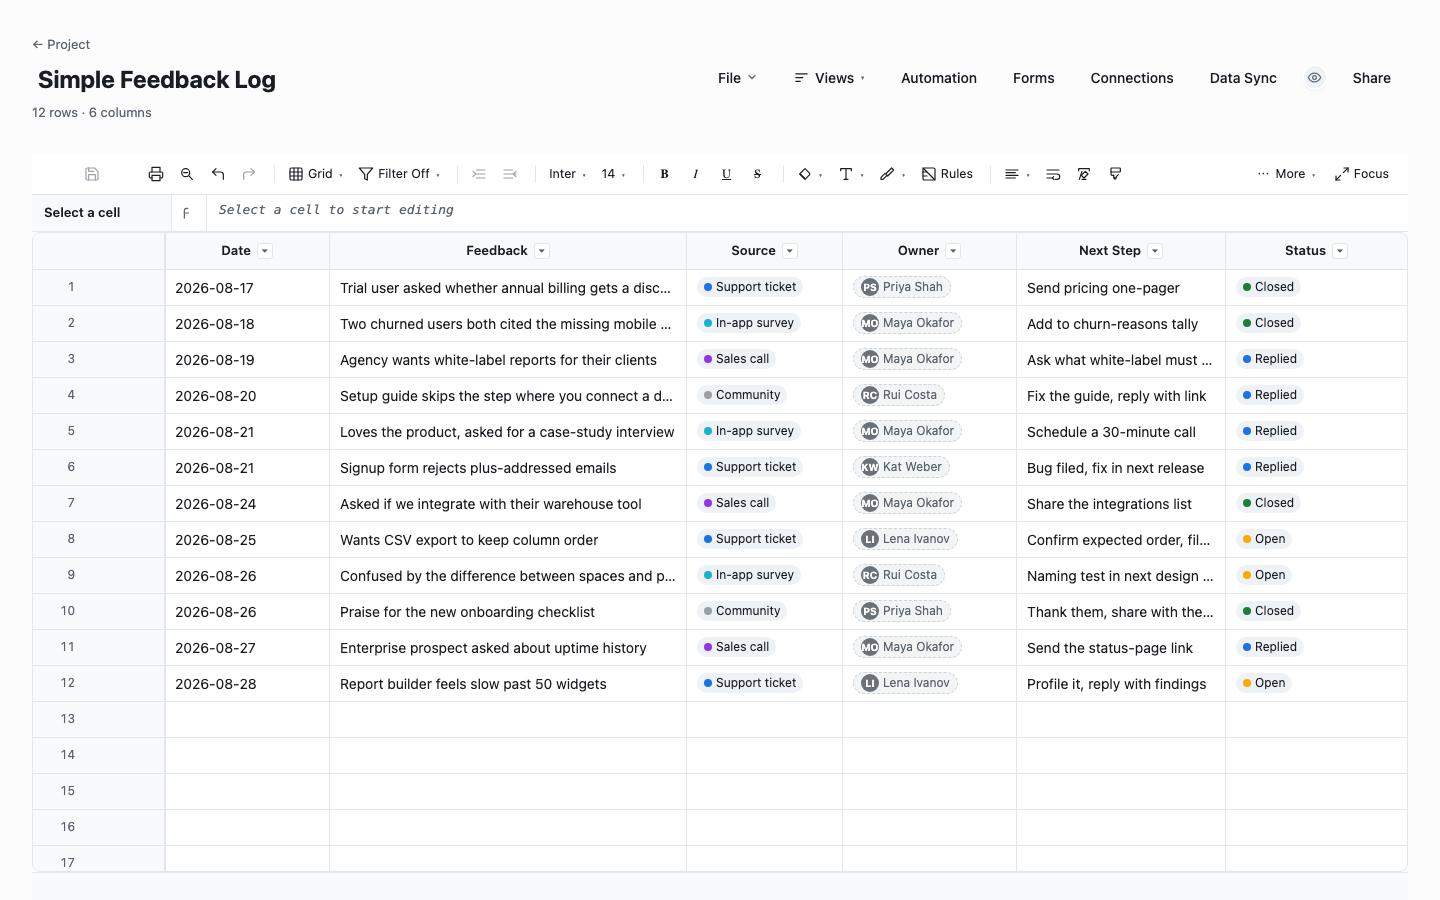
Simple Feedback Log
The no-machinery version: date, the feedback verbatim, where it came from, who follows up, what the next step is and whether it happened. No formulas, no scores, nothing to configure. It fits a young product where the founder still reads every message, and its whole job is making sure a kind word gets thanked and a bug report gets answered. Move up to the full tracker the week the volume stops fitting on one screen.
How to run feedback triage without it becoming a second job
Capture the quote verbatim, not your summary of it
The row should hold what the user actually said, because every summary quietly rounds the feedback toward what you already believed. "Export times out on anything over 10,000 rows" is a reproducible bug report; "export is slow" is a shrug. Verbatim quotes also make the sheet a persuasion tool later, when the roadmap conversation needs a customer voice rather than a tally.
Tag the source, because sources disagree
Support tickets skew toward bugs, sales calls skew toward the features that block deals, and app store reviews skew toward whatever made someone emotional enough to type. None of them is the truth alone. A source column lets you notice that the "top request" is really the top request of one channel, and that the quiet churn signals live almost entirely in support threads.
Use a small, fixed label set
Four labels cover most B2B products: Bug, Feature request, Praise and Churn risk. The temptation is a taxonomy with fifteen categories, and the result is that no two people tag the same quote the same way, which makes every count on the sheet unreliable. Keep the labels few enough that a count of them means something, and put nuance in the severity column instead.
Let the formula do the first pass
In Wisegrid the Type column is =CLASSIFY([Feedback]@row, "Bug, Feature request, Praise, Churn risk"), written once and expanded to every row by the engine. New rows tag themselves as they land, which turns triage from an hour of reading into a two-minute scan for the rows the model got wrong. Overriding a cell is allowed and expected: the formula is a first pass, and you are the editor.
Treat churn risk as its own queue
A churn signal is not feedback to file, it is a fire to walk toward. Filter the sheet to Type = "Churn risk" and give that view a different rhythm: an owner today, a reply within the day, and a status that does not read Closed until someone has actually talked to the account. The tracker exists so that "billed twice, fix this or we cancel" never sits unread for a week.
Close the loop, visibly
The highest-leverage row on the sheet is the shipped feature whose requester never heard about it. Keep the owner column honest and add a final step to your triage rhythm: when a row's request ships, someone tells the person who asked. Teams that do this convert complainers into references, and the sheet is what remembers who to write to.
The AI formula that does the tagging
The full tracker's Type column is one formula: =CLASSIFY([Feedback]@row, "Bug, Feature request, Praise, Churn risk"). You write it once at the top of the column; the engine expands @row for every row, reads that row's Feedback cell, and the model answers with exactly one of the labels you listed. Change the label list to match your team's vocabulary and every row re-tags. It recalculates like any other column, because it is one.
CLASSIFY is one of four AI functions live in Wisegrid today, next to =EXTRACT (pull one field out of messy text), =SUMMARIZE (condense a long note) and =AI (freeform). They are metered in dollars at cost with a hard ceiling: identical inputs are cached and free, and when the monthly budget hits zero the functions stop with a clear error instead of running up a bill. No automation to configure, no export to a chatbot and paste back.
In the Excel downloads, the Type and Score columns arrive filled in for the sample rows as computed values, because a spreadsheet file cannot run an AI model. That is the honest limit of a .xlsx. The live grid below runs the real loop: edit a Feedback cell and watch the Type cell re-tag itself.
Feedback triage or feature request tracking?
They are two stages of one pipeline, and merging them is how both break. Triage is fast and total: every piece of feedback gets a type, a severity and an owner within a day or two, including the praise and the one-off confusions that will never become work. The request backlog is slow and selective: only distinct feature requests live there, each accumulating requesters and a score over months.
The handoff is the Type column. Rows tagged "Feature request" get checked against the backlog: an existing request gains a requester and maybe a bumped reach score, a new one gets a row. That is why this page ships both sheets. Triage keeps faith with the people who wrote in; the backlog keeps the roadmap conversation honest about what the pattern of requests actually says.
When the triage sheet outgrows the file
A feedback file has two failure modes. The first is fragmentation: support tags feedback in their tool, sales keeps a slide, the community manager has a doc, and the "single source of truth" is four sources of partial truth that no one reconciles. The second is silence: a file cannot tag a new row on its own, cannot tell the owner a churn-risk row just landed, and cannot show a stakeholder the live state without another export.
In Wisegrid the same tracker becomes one shared sheet with the =CLASSIFY column running live, an intake form so anyone can drop feedback in without touching the grid, and automations that notify an owner the moment a row tags as churn risk. The people who only need to read it, executives, support, the whole company, view it free: Wisegrid charges $19 per editor and nothing per viewer. Import the .xlsx you just downloaded and the columns come with you.
Frequently asked questions
What should a feedback triage template include?
Seven columns cover it: the feedback verbatim, its source, the account it came from, a type, a severity, an owner and a status. Type and severity do different jobs and both earn their place: type says what kind of thing this is, severity says how much it should interrupt your week. The column teams skip is owner, and it is the one that decides whether follow-up actually happens.
How does the AI tagging work in this template?
In Wisegrid, the Type column is the formula =CLASSIFY([Feedback]@row, "Bug, Feature request, Praise, Churn risk"). The engine expands @row for each row, sends that row's feedback text to the model, and writes back one of the labels you listed, so a new row tags itself when it lands. You can override any cell by typing over it. In the Excel download the column arrives as computed values, since a .xlsx cannot run a model.
What labels should I use to categorize product feedback?
Start with four: Bug, Feature request, Praise and Churn risk. They separate the four different follow-ups that exist, which is the whole job: bugs get filed, requests get counted, praise gets thanked and churn risk gets a call. Add a label only when some follow-up genuinely differs, and edit the formula's label list in one place rather than re-tagging by hand.
How often should a team triage feedback?
Twice a week keeps the sheet honest for most teams; daily during a rocky release. The session should be short because the formula has already done the first pass: scan the new rows, correct any tag the model got wrong, set severity and owner, and walk the churn-risk rows first. If triage takes more than fifteen minutes twice a week, the label set is too big or the session is too rare.
How is this different from a feature request tracker?
Triage is total and fast: every piece of feedback gets a type, an owner and an answer, including praise and bug reports. A request tracker is selective and slow: only distinct feature requests, each accumulating requesters and a score across months. This page ships both, with the Type column as the handoff between them, because merging the two sheets is how both stop working.
Can I run this feedback triage template in Excel?
Yes. All three downloads open in Excel or any app that reads .xlsx, with dropdowns intact and the sample rows filled in. The two computed columns, Type and Score, arrive as values rather than live formulas: the score arithmetic is easy to rebuild with your app's functions, and the AI tagging is the part a spreadsheet file cannot do. Run the sheet in Wisegrid to get the tagging column live, or tag by hand in Excel.
Run it live instead of in a file.
The downloads above are yours either way. In Wisegrid the same template becomes a working sheet with owner contacts, status dropdowns, reminders, and dashboards. 7-day free trial, no credit card required.