Competitive Analysis Template: Free Downloads and a Comparison Guide for 2026
A competitive analysis is the disciplined answer to the question every founders meeting eventually asks: who else is solving this, and why would a customer pick us over them? A competitive analysis template turns that argument into a table, with the same factors compared across the same companies, so pricing, positioning, and feature gaps stop being opinions and become rows you can verify, date, and revisit on a schedule.
The failure mode it prevents is the vague one: we are better, they are bigger, nobody agrees on what matters. Done properly, the analysis compares factors a customer can actually check, prices on a normalized unit, and ends in positioning decisions, not a feature wish list. The four versions below cover the common shapes, from a side-by-side comparison matrix to a SWOT grid, using a fictional meal-kit service and three fictional rivals as the worked example.
Four competitive analysis templates, free to download
Each version below is a working spreadsheet, not a blank grid with a title row. The fields are pre-filled with realistic example content from a fictional meal-kit service and its three fictional competitors, so you can see how a finished analysis reads, then overwrite it with your own market. What you download is an everyday spreadsheet file, compatible with all the usual tools. No email address required.
Competitor Comparison Matrix
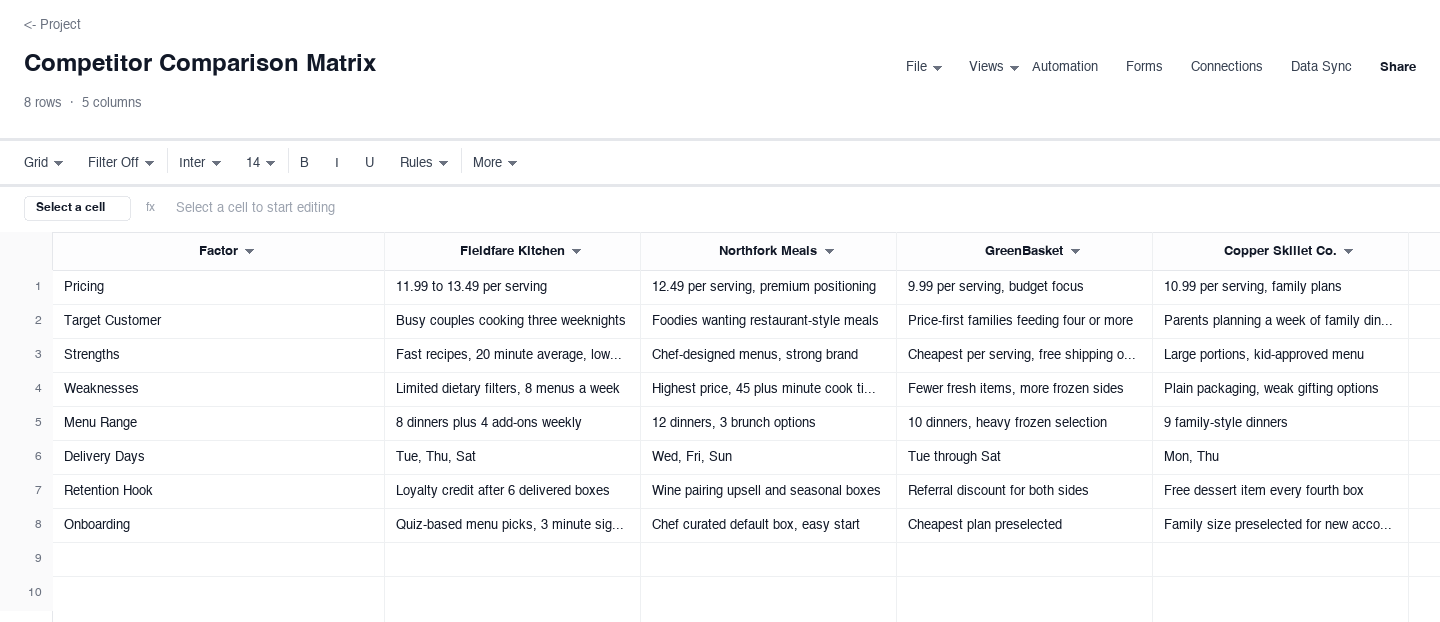
The competitor comparison matrix is the classic side-by-side view: factors as rows, your company and each competitor as columns, with pricing, target customer, strengths, weaknesses, menu range, and retention hooks compared in the same grid. Use it as the home base of the analysis, the page everyone updates and quotes. The factor column is what keeps the whole thing honest, because every claim has to compress into one cell, which exposes hand-waving fast and gives the team a single surface to debate during the quarterly review.
Feature Comparison
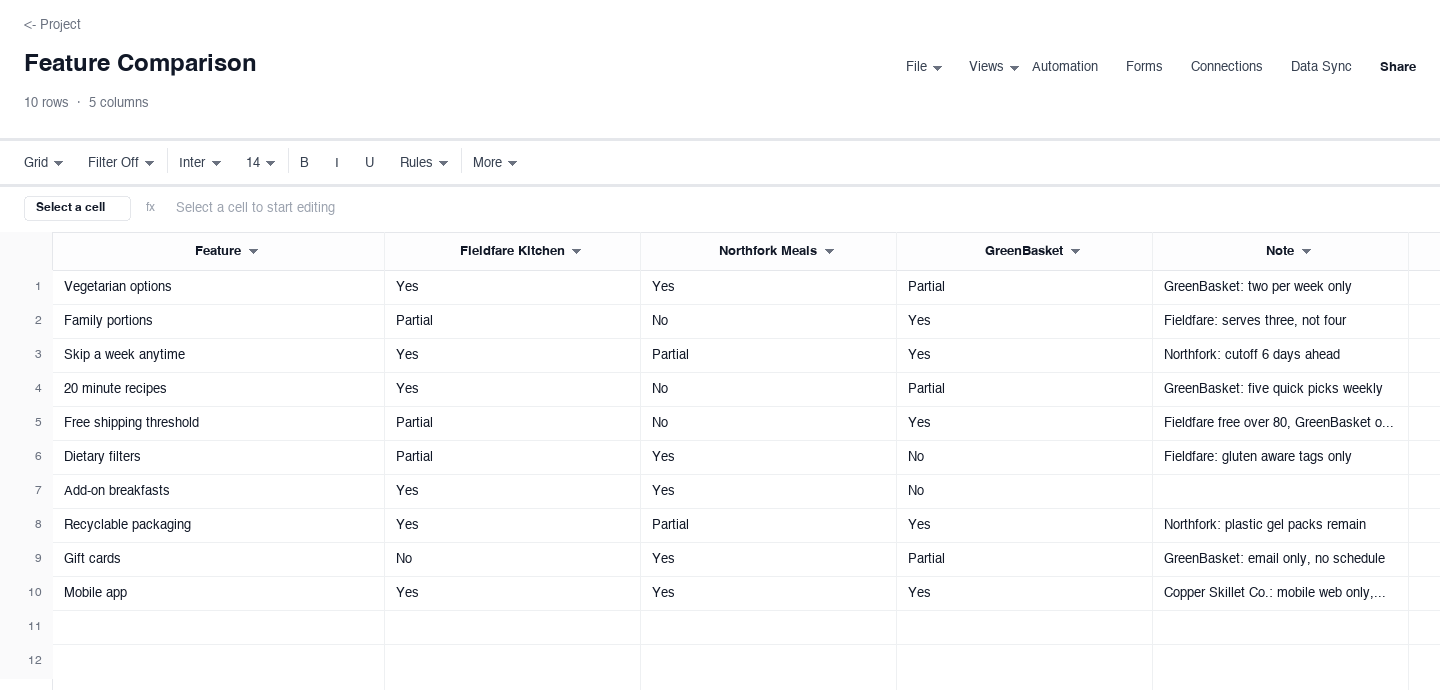
The feature comparison grid lists concrete capabilities as rows with your company and each competitor as columns, answered as facts like Yes, No, or Partial, plus one note column for nuance. Use it when buyers ask how you stack up, or when the product team wants a defensible answer about what to build next. The note column earns its keep by carrying the asterisks, the yes-but cases like a feature that exists only on the top plan, so the grid stays truthful without turning into footnotes.
Pricing Competitive Analysis
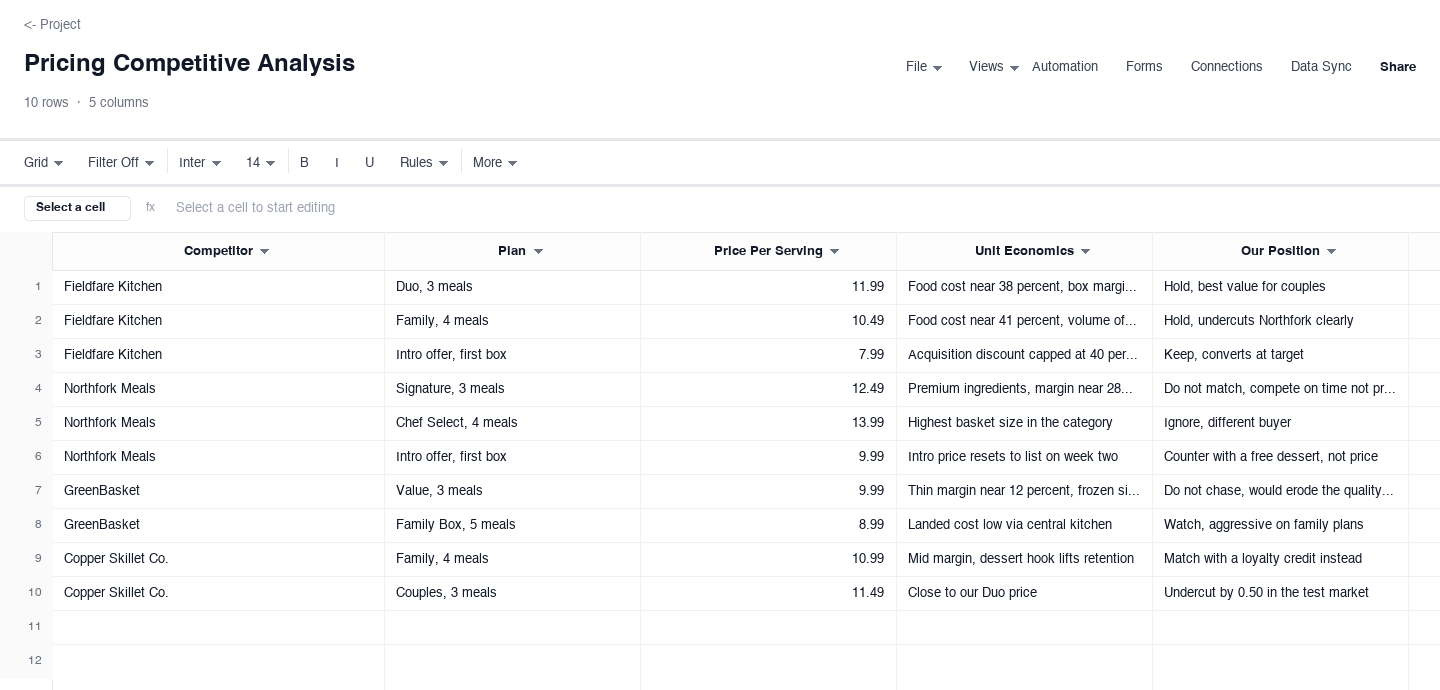
The pricing competitive analysis normalizes what every competitor charges into one number per plan, so introductory prices, renewal prices, and per-unit economics can be compared row by row. Use it before you set or change your own pricing, and before sales calls where discounting comes up. The our position column is the one that pays for the template: it forces a written stance on each plan, match, undercut, or deliberately premium, so pricing stops being improvised deal by deal and starts being a decision.
SWOT Competitive Analysis
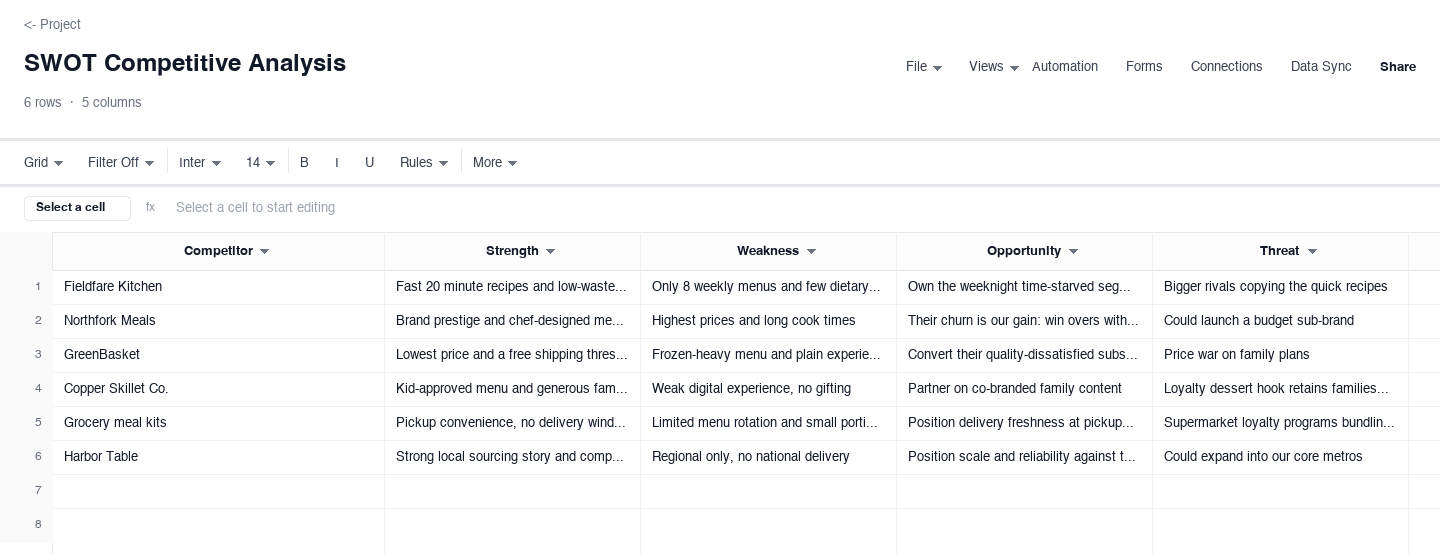
The SWOT competitive analysis gives each competitor its own row with strength, weakness, opportunity, and threat columns, plus a row for your own company. Use it in a positioning workshop, after the factual grids are done, to turn findings into strategy. The discipline that makes it work is writing weaknesses and threats about the market and the customer, not about the other company being bad, because an insult is not a strategy and an opportunity you can act on is.
How to run a competitive analysis that actually changes decisions
Pick three to five competitors you actually lose to
The list should come from your last twenty lost deals, not from whoever is biggest or loudest. Include the rival that keeps showing up in final-round comparisons, the cheaper substitute customers mention when budget is tight, and at most one aspirational giant for direction. Ten competitors is a report nobody reads; four competitors is a decision document. Write the selection rule at the top of the sheet so next quarter you can tell whether the market moved or your sample did.
Compare factors a customer can verify
Every row in the matrix should be checkable by a customer in under five minutes: published prices, delivery days, cancellation terms, plan tiers, shipping thresholds. Avoid rows like brand perception or quality, which are vibes until you have survey data, and mark anything you could not verify as unverified rather than guessing. A competitive analysis full of confident unverified claims is worse than none, because the whole team starts steering by it and nobody knows which numbers are real.
Normalize pricing to one unit and separate intro from renewal
Pricing is where lazy comparisons go wrong. Convert every plan to the same unit your customer thinks in, per serving, per seat, per month, and record both the introductory price and the renewal price, because some competitors win deals with a first bill that quietly doubles. Note what is excluded from the headline price: shipping, setup, minimum order sizes. The pricing variant above carries a unit economics column for exactly this, so you can see what a competitor is likely earning per order, not just what they are quoting.
Write the feature grid as facts, then one honest note
Answer each feature cell with Yes, No, or Partial, and resist adjectives. Partial covers the yes-but cases: available only on the top tier, shipping only in certain regions, works on desktop only. Put the nuance in the note column rather than upgrading a Partial to a Yes, because the first time a prospect catches the grid being generous, every cell loses credibility. Date the grid in the header; feature tables rot quickly, and a stale grid is how salespeople get surprised on calls by a capability a competitor shipped last month.
Turn findings into positioning, not a feature race
The output of the analysis is a small set of positioning decisions: the segment you will own, the comparison you want customers to make, and the fights you will decline. A weakness in a competitor is only an opening if you can serve that customer profitably and say so credibly; otherwise it is a distraction. Write the decisions into a business case with owners and dates, because an analysis that ends in a slide nobody acts on was an expensive way to feel informed.
Set a review cadence, an owner, and trigger events
Competitor data rots on a quarterly schedule at minimum, and faster in volatile markets, so assign one owner and a standing review date. More important than the calendar are the trigger events that force an off-cycle refresh: a funding round, a price change, a flagship feature launch, a leadership change, a sudden wave of reviews. List your triggers at the top of the sheet. The worst outcome is not a wrong analysis, it is an outdated one being quoted as current in a pricing meeting.
Need a competitive analysis template for a slide deck?
Competitive analyses get presented as often as they get maintained, usually as a two-by-two positioning chart or a simplified matrix in a deck. The downloads above are .xlsx files by design, because the analysis lives as a working document with dates and sources long before it becomes a slide, but the comparison matrix converts cleanly: copy the factor rows into your deck, keep one column per company, and drop the nuance into speaker notes where it belongs.
Keep the working spreadsheet as the source of truth and treat every deck version as a snapshot of a date, because the fastest way to lose a room is presenting last quarter prices as current. The pricing and SWOT variants above are shaped so each row pastes into a slide without re-editing, and the fictional meal-kit example shows the level of compression a board slide can actually carry.
Frequently asked questions
What is a competitive analysis?
A competitive analysis is a structured comparison of the companies you compete with, covering the factors customers use to decide: pricing, target segments, features, strengths, and weaknesses. Its purpose is to turn positioning from opinion into something the team can verify and revisit. The comparison matrix and feature comparison variants above are the two most common shapes, one for strategy conversations and one for capability conversations.
How is a competitive analysis different from a SWOT analysis?
A competitive analysis is factual groundwork: prices, features, delivery terms, verified and dated. A SWOT analysis is the strategic read built on top of that groundwork: strengths, weaknesses, opportunities, and threats, with an emphasis on what you do about them. Do the factual grids first and the SWOT second, because a SWOT written from memory is just opinions in quadrants. This page ships both, so the SWOT row for your own company can quote the numbers from the matrix.
How do you collect competitive data without guessing?
Use what a customer can see: published pricing pages, sign-up flows, plan tiers, help centers, shipping terms, app store listings, and honest mystery shopping, like placing one order with a rival. Record the date next to every data point and mark anything you could not verify as unverified rather than filling the cell from a hunch. The unit economics and our position columns in the pricing variant above force this discipline because they make unsupported numbers visible.
How often should you update a competitive analysis?
On a fixed cadence of at least once a quarter, plus whenever a trigger event fires: a competitor changes pricing, ships a flagship feature, raises money, or changes leadership. Pricing and feature rows rot fastest, so date them and sort the review by oldest first. A stale analysis quoted as current is worse than no analysis, because the team steers by it with confidence. Assign one owner; a shared spreadsheet with no owner is a museum.
What is a pricing competitive analysis?
A pricing competitive analysis compares what competitors charge on a normalized unit, per serving, per seat, or per month, separating introductory pricing from renewal pricing and noting what the headline price excludes, like shipping or minimum orders. It usually adds unit economics, what the competitor likely earns per order, so you can see whether a price war is a fight you can afford. The pricing variant above carries our position column so each comparison ends in a decision: match, undercut, or stay deliberately premium.
Can I do a competitive analysis in Google Sheets?
Yes, and for most teams a spreadsheet is the right tool, because the analysis is a living document that needs dates, owners, and frequent edits more than it needs charts. Download any variant above as an .xlsx file and open it in Google Sheets or Excel, or upload it to a collaborative workspace like Wisegrid where the comparison matrix, feature grid, pricing rows, and SWOT rows can sit in one shared sheet with dropdowns and owners instead of four files nobody reconciles.
What mistakes make a competitive analysis useless?
Three, and they account for most of the wasted effort. The first is collecting facts nobody will act on: if a row cannot change a decision, cut it. The second is letting the sheet age: a pricing table from nine months ago is worse than none, because it gives false confidence, so assign an owner and a review date before the first entry goes in. The third is analysis without a question: decide what you are deciding, a price change, a feature bet, a positioning shift, and collect only the comparisons that inform it. The matrix version above keeps the row set small on purpose, because a page you actually maintain beats a database you abandon.
Run it live instead of in a file.
The downloads above are yours either way. In Wisegrid the same template becomes a working sheet with owner contacts, status dropdowns, reminders, and dashboards. 7-day free trial, no credit card required.