Gantt Chart Template: Free Downloads and a Schedule-Building Guide for 2026
A Gantt chart template is the standard way to plan work that has to happen in order. Where a task list tells you what exists and a timeline tells you when things land, a Gantt chart adds the two dimensions that make a schedule real: how long each task runs, and which tasks cannot start until others finish. Every row is a task with an owner, a start, an end, and usually a percent complete, and the bars those dates draw are the picture of the project a team actually argues from.
The versions below cover the four schedules people actually build. The simple Gantt tracks tasks with durations and percent complete for a straightforward job. The Gantt with dependencies records what each task waits on, which is where the real risk lives. The Gantt with milestones mixes zero-length milestone rows into the task list so sponsors can read it. The by-week Gantt compresses ten weeks into checkbox columns for teams that plan at week granularity.
Four Gantt chart templates, free to download
Each version below is a working spreadsheet, not a blank grid with a title row. The fields are pre-filled with realistic example content from a fictional office fit-out and a fictional app release so you can see how a finished schedule reads, then overwrite it with your own tasks and dates. What you download is an everyday spreadsheet file, compatible with all the usual tools. No email address required.
Simple Gantt
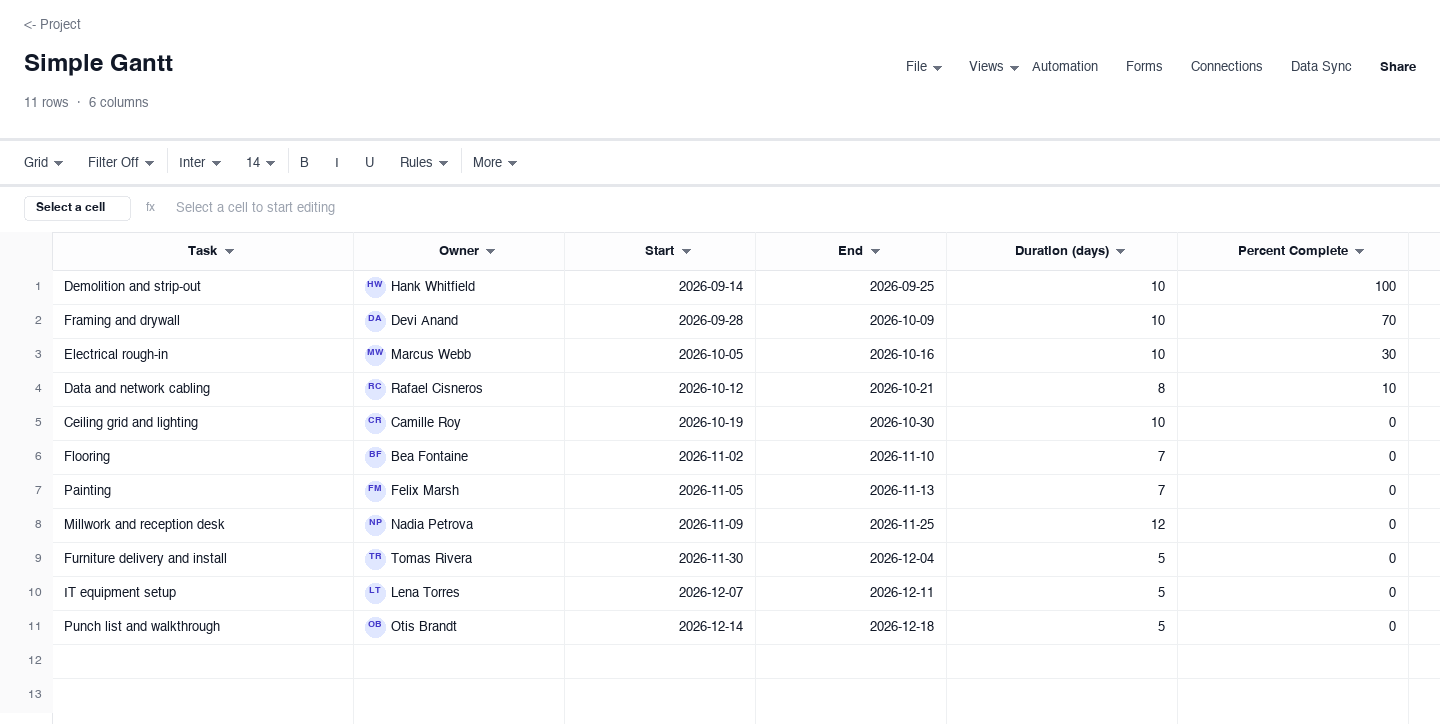
The simple Gantt is the everyday schedule for a project with one crew and no exotic logic: each row carries a task, an owner, a start, an end, a duration in days, and a percent complete. Use it for fit-outs, events, and product pushes where the order of work is obvious and the question is pace, not logic. The percent complete column is the one that earns its keep, because a bar parked at 90 percent for three straight weeks is the number that tells you to stop asking how it is going and start asking what is actually left.
Gantt With Dependencies
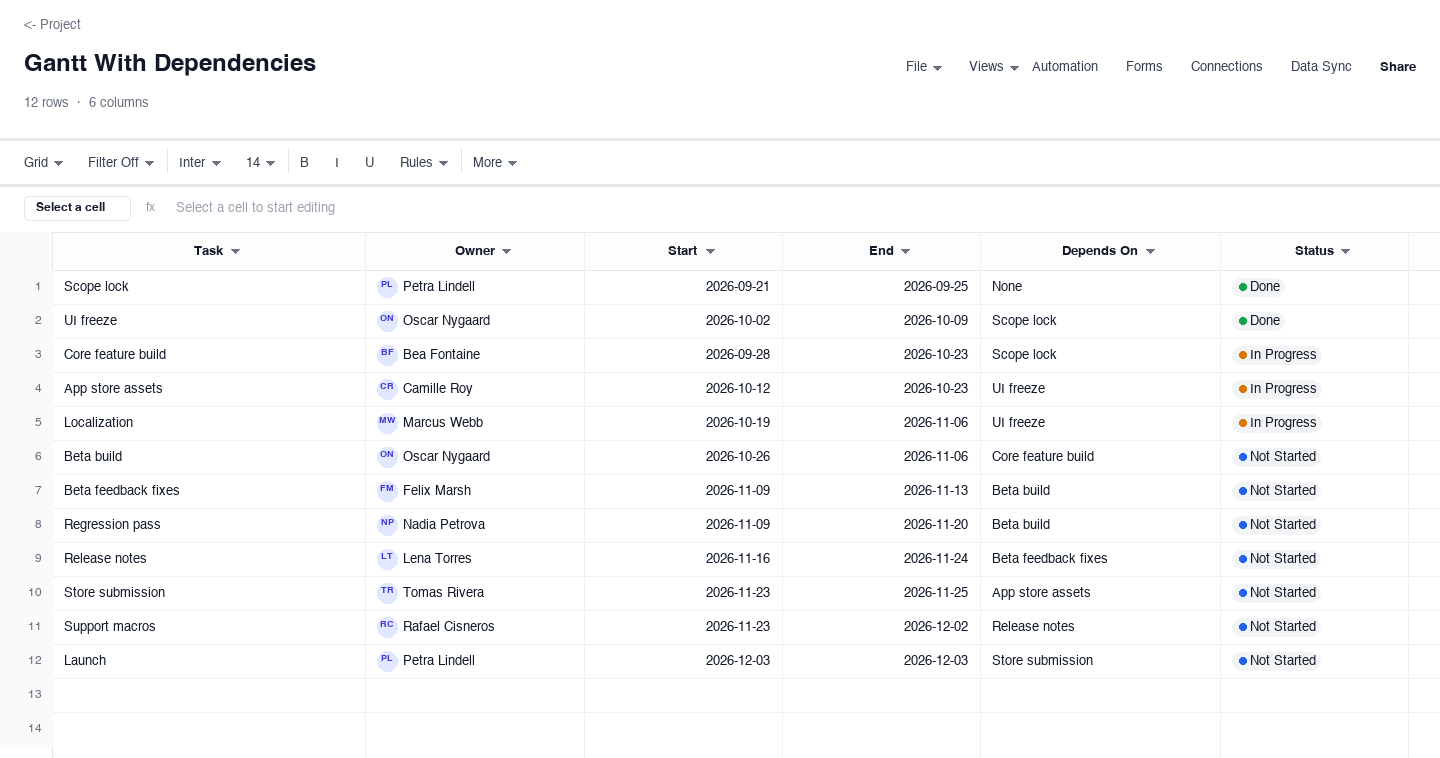
The Gantt with dependencies is for schedules where the order is the risk: each row keeps its owner and dates and adds a depends-on column naming the task it waits on, plus a status. Use it for launches and multi-team work where one slip fans outward. The depends-on column earns its keep the morning after a slip, when a single search for the late task lights up every downstream row, and the list you read off is the recovery plan instead of a surprise.
Gantt With Milestones
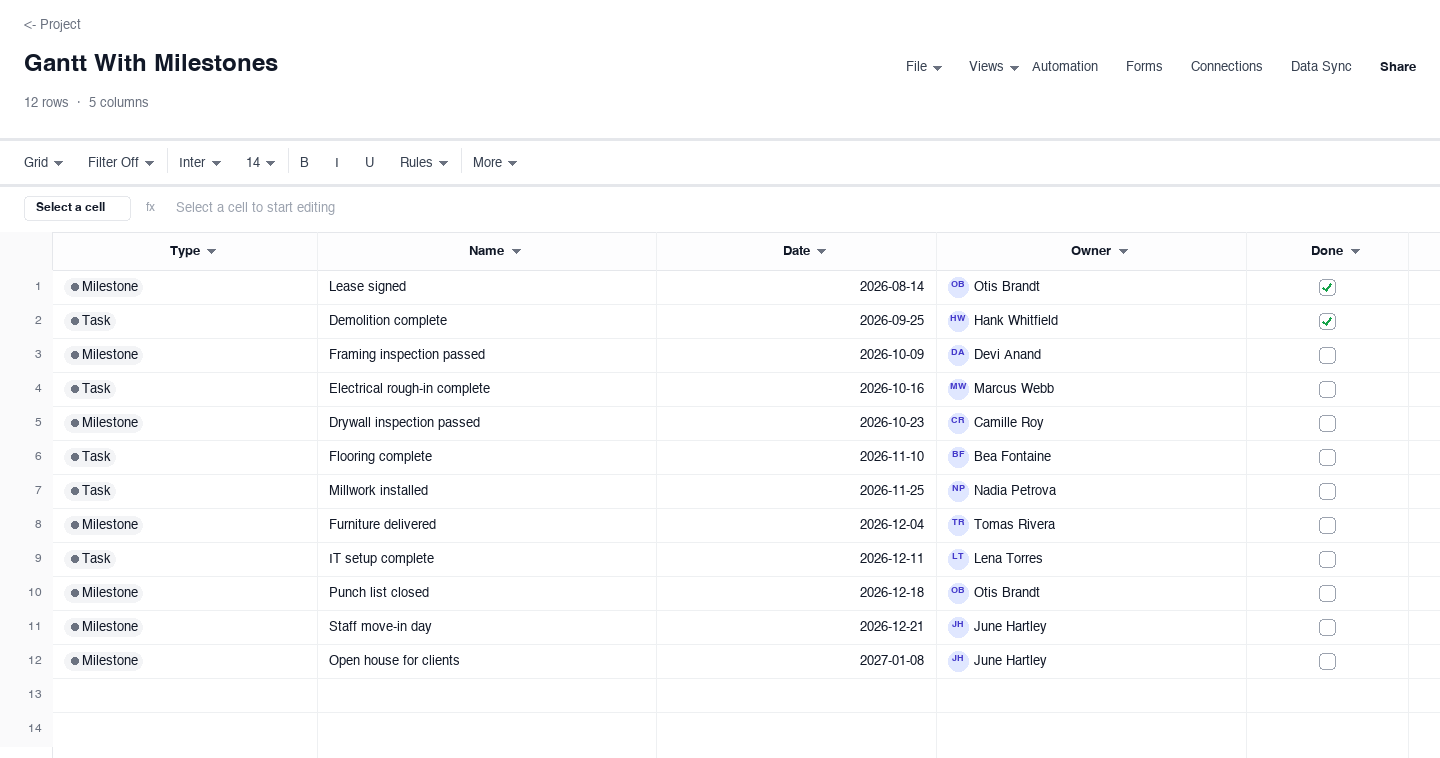
The Gantt with milestones mixes two row types: tasks with real dates, and milestones, which are zero-duration events like inspections passed or launch day. Each row carries a type, a name, a date, an owner, and a done flag. It is the version to hand people who fund or approve the work. The type column earns its keep when you filter to milestones for a sponsor update and get a one-page summary in a single click, instead of retyping the highlight reel by hand every time someone asks how it is going.
Gantt By Week
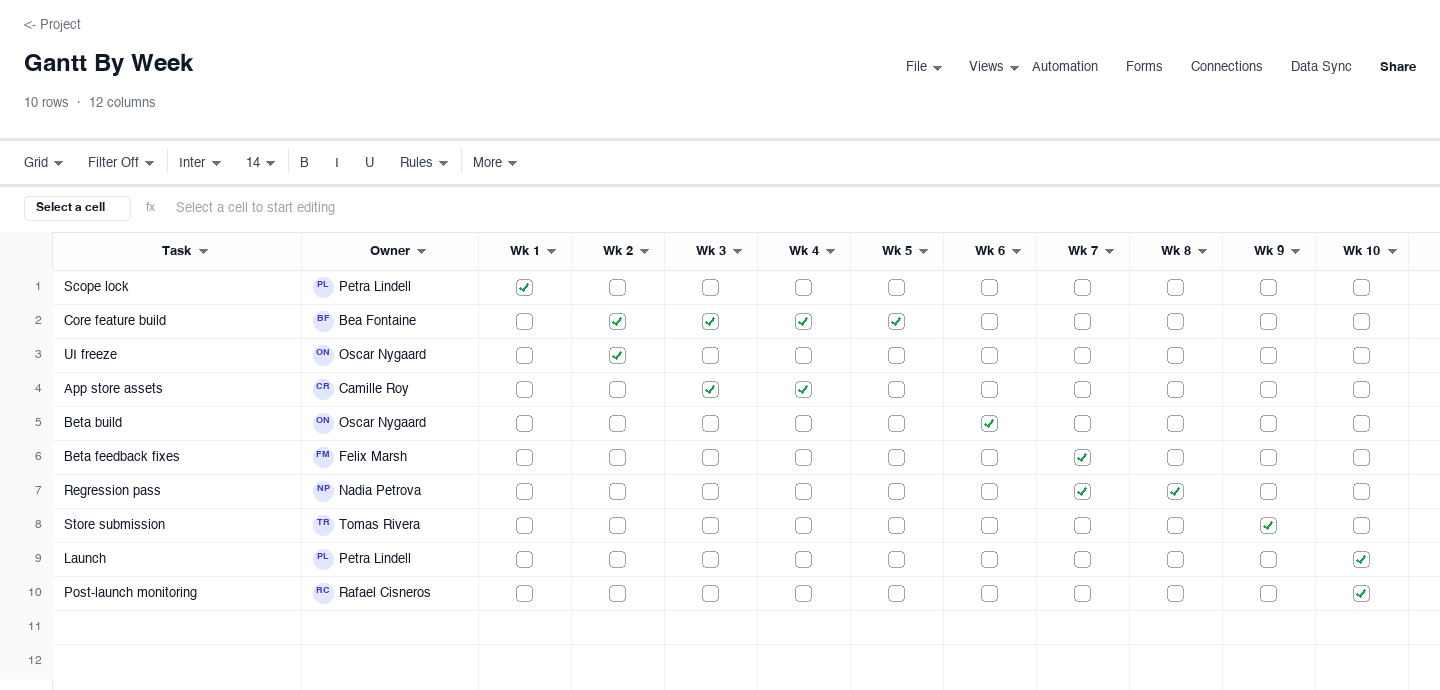
The by-week Gantt compresses a ten-week window into checkbox columns: each row is a task with an owner, and the box under each week is marked for the weeks the task is active. It trades date precision for a view a whole team can read in a standup. The weekly columns earn their keep in the status meeting, when you scan a single column and see what should be happening this week across every task at once, which is the fastest overload check a schedule can give you.
How to build a Gantt chart that survives contact with the project
List every task before you draw a single bar
A Gantt chart is only as good as the task list underneath it, so write the list first and draw nothing until it is complete. Break the project into tasks one person can finish in about a week, two at most: framing and drywall is a task, build the office is not. Verb-led names, rough-in electrical, not electrical phase 2. If a task needs two owners or runs past two weeks, split it. Granularity is not bureaucracy here; it is the resolution at which slip becomes visible while you can still do something.
Estimate durations from evidence, not optimism
Every bar length is an estimate, and estimates made in a hopeful mood are how schedules die. Base durations on what similar work actually took last time: the drywall that took nine days on the last floor takes nine days here, whatever the crew promises. For work with real uncertainty, estimate the optimistic, likely, and worst cases and plan on the likely plus a share of the spread. Keep contingency as visible buffer at the end of the schedule rather than padding hidden inside every task, because hidden padding gets spent automatically and visible buffer gets defended.
Link dependencies the way the work actually flows
Most work links finish-to-start: the next task begins when the previous one ends, paint starts when drywall passes inspection. Record each link in the depends-on column by naming the predecessor task, and be suspicious of tasks with no dependency at all, because that usually means an assumption nobody wrote down. Then audit the links for the two classic errors: a task that everything depends on but nobody scheduled early enough, and a loop where A waits on B and B waits on A. Both are invisible until the week they burn you.
Find the critical path and protect it deliberately
The critical path is the longest chain of dependent tasks, and it sets the finish date: a day lost anywhere on it is a day lost on the project, while a day lost elsewhere is absorbed. Trace it through your dependency column and mark it, then manage it differently from everything else. Critical tasks get the senior people, get checked twice a week instead of once, and get help the moment they wobble. The classic failure is treating all tasks as equal and discovering, three weeks late, that the one that slipped was the one the whole finish date hung on.
Track percent complete in honest increments
Percent complete is a report, not a feeling, so fix the scale and hold people to it. A workable scale is 0, 25, 50, 75, 100: not started, setup done, half, integration and testing, done. The number that should alarm you is 90, because a task at 90 percent for several weeks is a task whose owner is guessing, and the last 10 percent is where integration bugs, punch lists, and approvals actually live. Update every Friday, in the same fifteen-minute pass where dates get corrected, so the chart reflects Friday reality and not the kickoff plan.
Baseline the dates, and re-baseline only on purpose
Before work starts, save a copy of the original dates as the baseline. From then on the schedule can tell you two different things: where you planned to be, and where you are, and the gap between them is the number a steering meeting actually needs. When a change is approved, a scope addition, a moved deadline, re-baseline deliberately and note that you did, so future slip is measured against the new truth and not laundered into the old one. Schedules that get silently edited every week lose the ability to say anything at all about how the project is really going.
Looking for a Gantt chart template in Excel?
The Excel searches are really asking one question: can I have the schedule as a workbook file? Yes. Every download on this page is an .xlsx file that opens directly in Excel, and for a small project that is often the right home: one file, one project, emailed to the people who need it. The honest limit arrives when dates change weekly, because a file in an inbox chain sil forks, and nobody is sure which copy is current by week three.
If the destination is specifically a spreadsheet file with the bars drawn by formulas and stacked charts, the dedicated Excel Gantt chart template page walks through that build step by step, including the conditional-formatting trick that paints the bars. It is linked below. Use the page you are reading now for the scheduling craft, the durations, dependencies, and honest percent complete, because that part transfers to any tool.
Frequently asked questions
What is a Gantt chart used for?
A Gantt chart plans and tracks work that happens in order: each task gets an owner, a start, an end, and usually a percent complete, and the bars those dates draw show how long everything runs and where the overlaps and dependencies sit. It is the right tool when durations and ordering are the risk, such as renovations, launches, and events. The four versions above cover the simple schedule, the schedule with dependencies, the version with milestone rows, and a ten-week checkbox view.
How do I make a Gantt chart in Excel?
Two honest routes. The fast one: download any version on this page, since each is an .xlsx file that opens in Excel, and type your tasks, owners, and dates over the examples. The craft one: build the bars in the workbook itself with a stacked bar chart plus conditional formatting, which the dedicated Excel Gantt chart template page walks through step by step and which is linked from the related cards below. Either way, the scheduling discipline on this page, the durations, the dependency column, the honest percent complete, is what makes the chart useful.
What is the difference between a Gantt chart and a timeline?
A timeline answers when in sequence: milestones and dates on a track, built to be read. A Gantt chart adds duration and dependency logic: bars with lengths, tasks linked to predecessors, a critical path you can protect. If you are communicating a sequence, use a timeline; if you are managing the lengths and the order of work, use a Gantt chart. Many projects run both: the Gantt chart drives the weekly working meeting and the timeline summarizes the same dates for people who were not in it. The timeline template page covers the other half.
How do I show dependencies on a Gantt chart?
Give the dependency its own column and name the predecessor task in plain text, finish drywall inspection is what paint waits on. Most links are finish-to-start, meaning the next task begins when the previous one ends, and that is the only type most projects ever need. Write them as you estimate, not afterward, because retrofitted links tend to describe the schedule you wish you had. The payoff is the audit: when a task slips, search the column for its name and every affected row appears, which turns a bad Friday into a recovery plan instead of a slow-motion surprise.
How do I track progress on a Gantt chart?
With a percent complete column updated on a fixed rhythm, usually every Friday in the same short pass where dates get corrected. Hold the scale to honest increments, 0, 25, 50, 75, 100, and treat any task that sits at 90 percent for multiple weeks as a question, not a status, because the final stretch is where integration, approvals, and punch lists live. Percent complete pairs with the baseline dates: planned versus actual is the sentence the chart exists to say, and it only gets said when both numbers stay current.
What is a milestone on a Gantt chart?
A milestone is a zero-duration event: inspection passed, lease signed, launch day. It marks a point the project either hits or misses, and it carries no work of its own, which is why the milestone version above stores it as a type on the row rather than a date range. Milestones earn their keep with people outside the day-to-day work: filter to them and a sponsor gets the whole story on one page, and a steering meeting can argue about the five dates that matter instead of the ninety that do not.
Run it live instead of in a file.
The downloads above are yours either way. In Wisegrid the same template becomes a working sheet with owner contacts, status dropdowns, reminders, and dashboards. 7-day free trial, no credit card required.