Fishbone Diagram Template: Sort Causes With the 6M Method for 2026
A fishbone diagram template is the working version of the cause-and-effect diagram, the Ishikawa or fishbone chart that quality teams have used for decades. The problem sits at the head of the fish, and the bones are candidate causes, sorted into categories so the discussion does not collapse into a brainstorm with no floor. The classic categories are the six M's: Man, Machine, Method, Material, Measurement, and Mother Nature. A good session fills every category with at least one candidate, because the cause nobody typed usually lives in the category nobody opened.
The spreadsheet version keeps the diagram's logic but not its drawing chores. The head of the fish is the problem statement, each category is a row set, and each cause hangs off its category with the evidence behind it and a call on whether it is likely. You lose the picture and gain something better: a sortable, testable list you can hand to the people who will actually run the experiments, with the verification written next to each suspect instead of lost on a whiteboard.
Four fishbone diagram templates, free to download
Each version below is a working spreadsheet, not a blank grid with a title row. The fields are pre-filled with realistic example content from fictional companies, a packaging plant tracking seal failures and a family clinic working on long check-in waits, so you can see how a finished fishbone reads as a table. Overwrite it with your own problem and causes. No email address required.
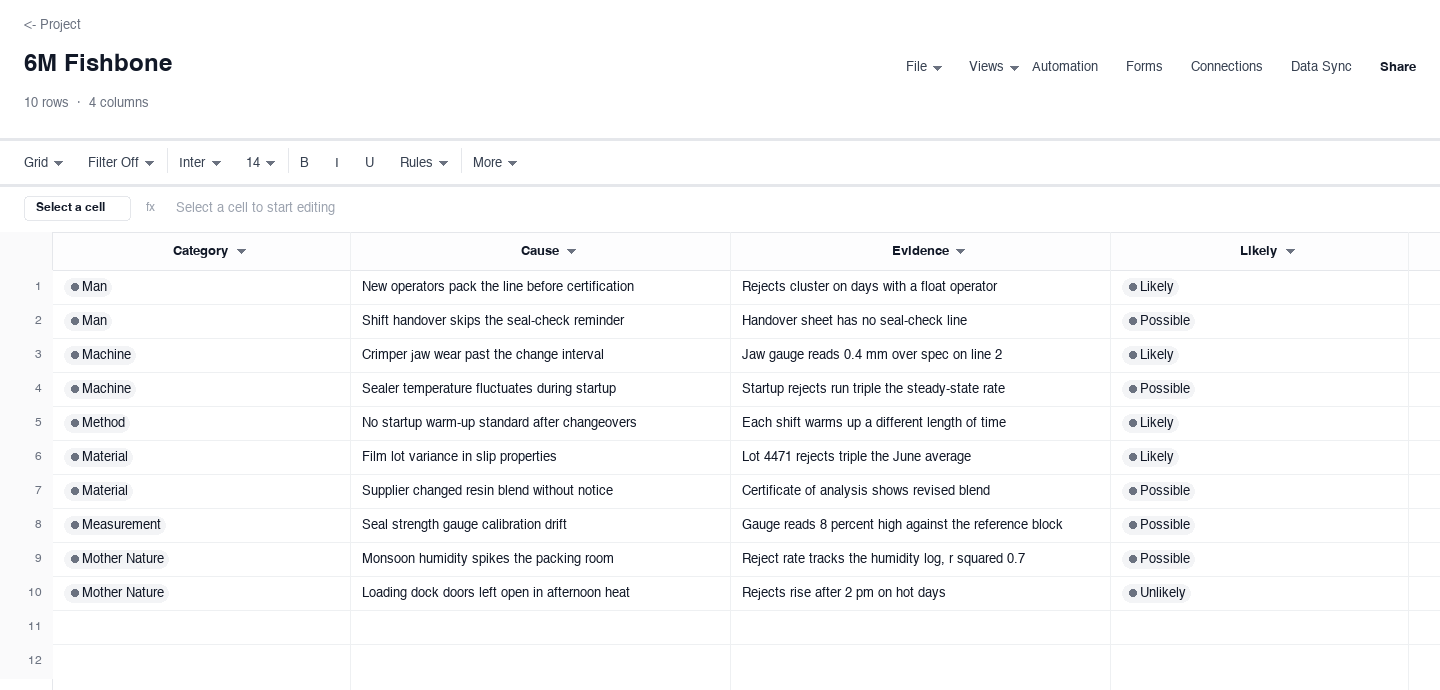
6M Fishbone
The 6M fishbone is the classic: every candidate cause sorted into Man, Machine, Method, Material, Measurement, or Mother Nature, each with the evidence behind it and a likelihood call. Use it when a team first gathers around a recurring problem, like the seal failures pre-filled here from a fictional packaging plant. The fixed category set is the quiet feature that earns its keep: it forces the group to walk every bone instead of camping on the first explanation, which is where causes like measurement error usually hide until someone opens that folder.
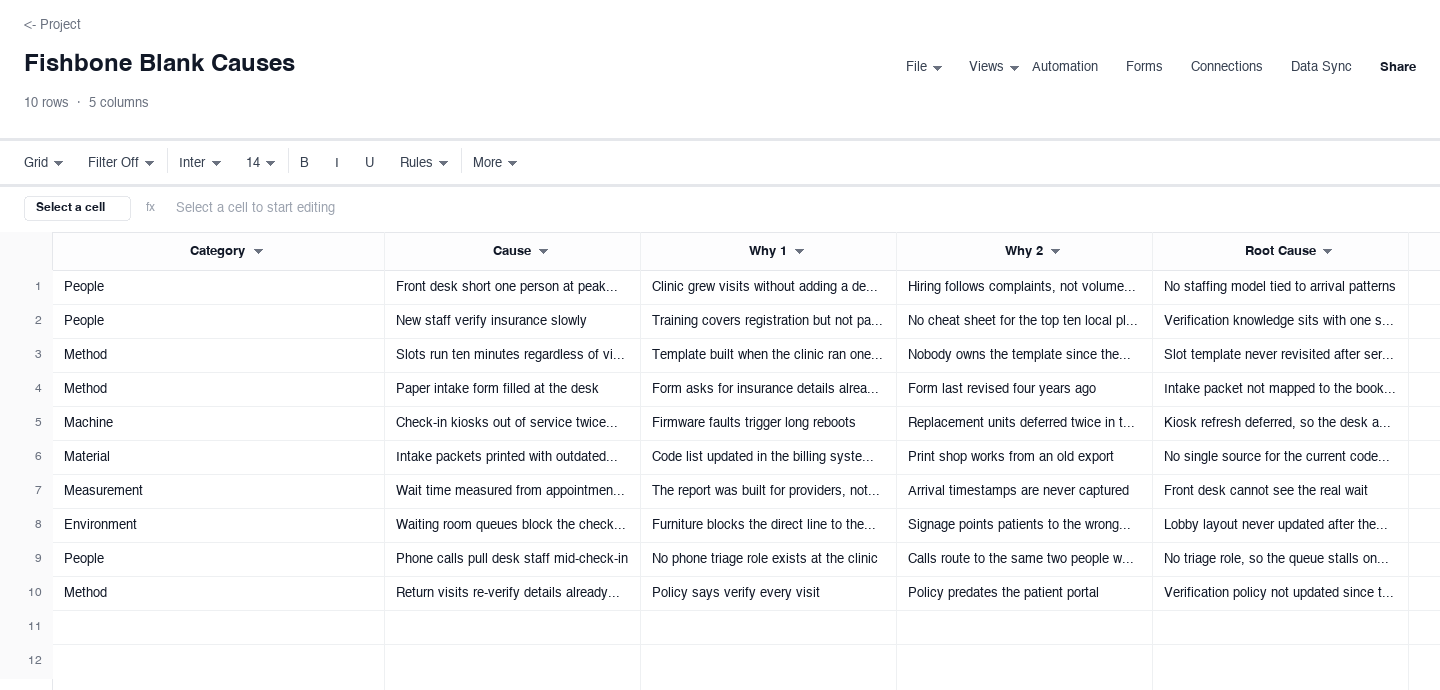
Fishbone Blank Causes
The blank causes version strips the category scaffolding and runs the 5 Whys instead: every cause carries two why columns that drill past the first complaint toward something fixable, ending in a stated root cause. Use it when the problem is small enough that one row set tells the story, like the check-in waits here. The two why columns earn their keep in the meeting itself: they keep the room asking past the first answer, and a chain that dead-ends at a person is your signal to ask once more.
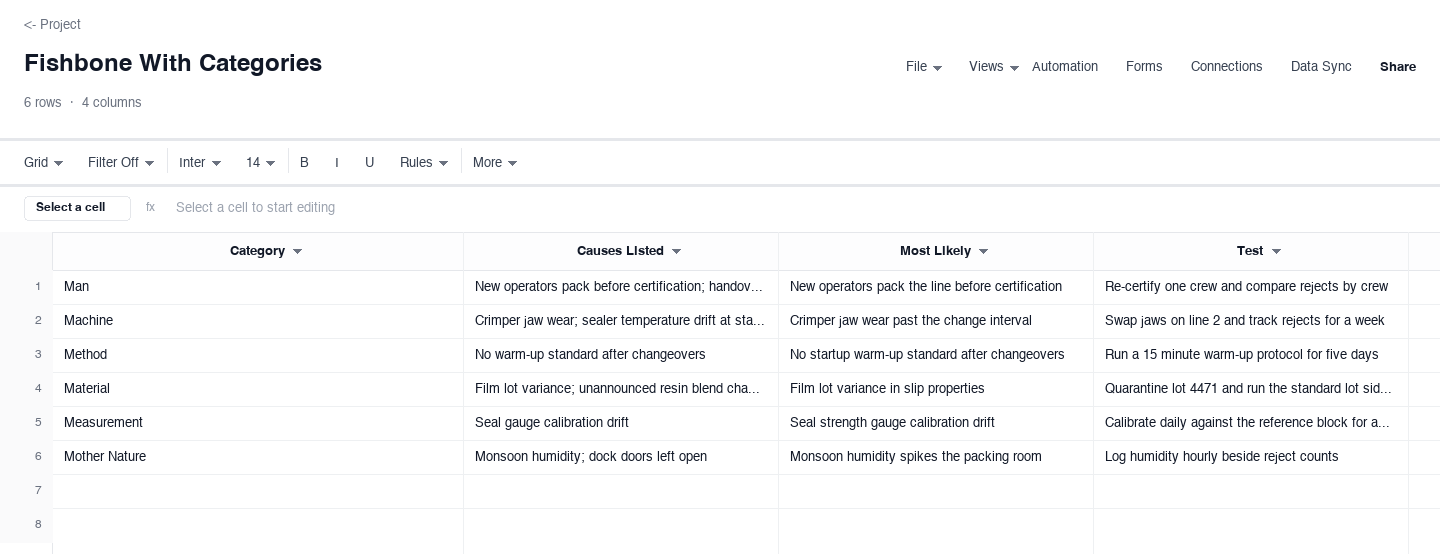
Fishbone With Categories
The categorized version shifts the work from listing to testing: one summary row per category, its causes collected in a single cell, the most likely candidate named, and the cheapest test that would confirm or clear it. Use it after brainstorming, when the list is long and the budget is not, like the seal failure hunt here. Naming one most likely per category earns its keep at the scheduling conversation, because it turns a vague follow-up into an assigned check with a cost and an owner.
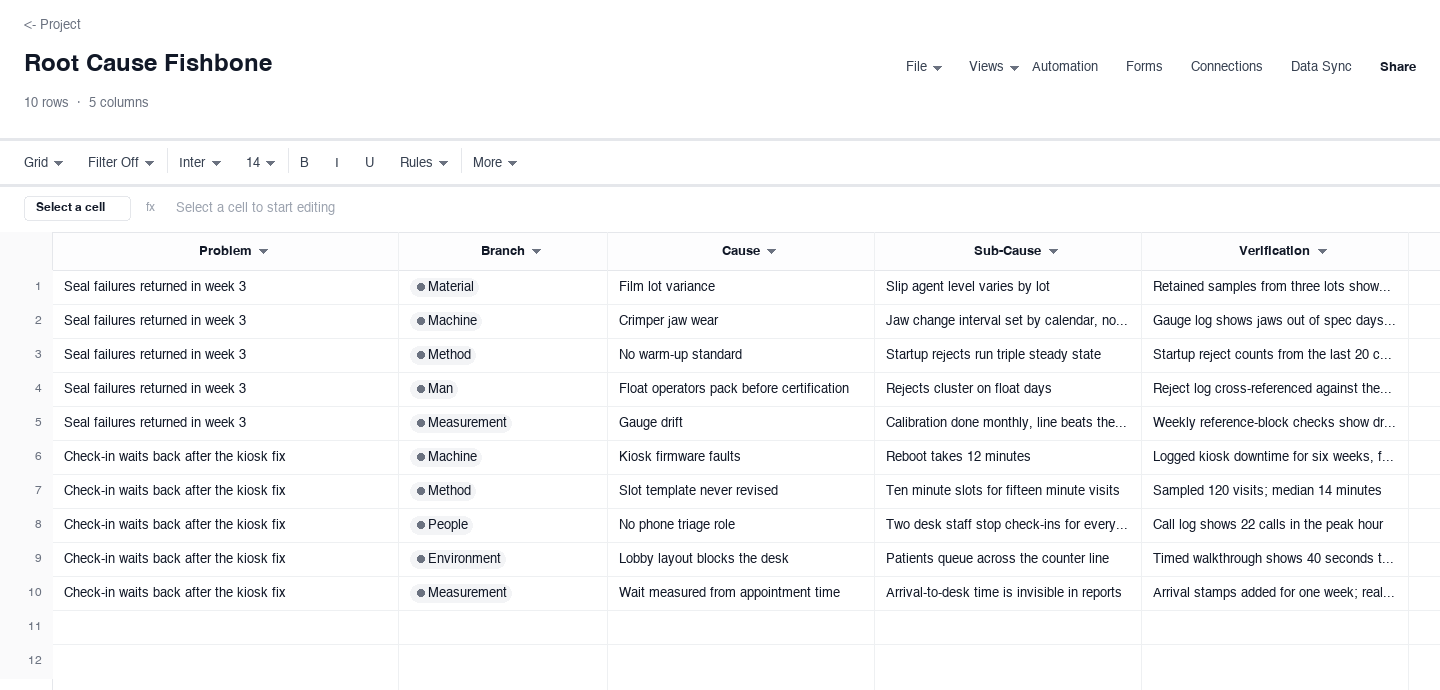
Root Cause Fishbone
The root cause version is for problems that keep coming back after a fix: a problem statement, then branch, cause, sub-cause, and the verification that proves the chain is real. Use it when the symptom has survived one repair cycle already. The verification column is the discipline that earns its keep: no chain counts as confirmed until someone writes down how they checked it, because a root cause asserted without verification is just a guess the team has agreed to stop questioning.
How to run a fishbone session that finds the real cause
Write the problem as one specific sentence
The head of the fish gets one sentence with a number and a timeframe: "3.1 percent of pouches failed seal strength checks in August." Not "seal problems," not "quality issues." A vague head makes every bone equally plausible, and the session drowns. A specific head does the opposite: it rules out half the room's pet theories in the first five minutes, which is the fastest way to earn the skeptic's attention for the rest of the hour.
Fix the six categories before the meeting
Man, Machine, Method, Material, Measurement, Mother Nature: write them on the grid before anyone arrives, and assign each category a spokesperson from the people who own that bone. Operators for Man, maintenance for Machine, the process owner for Method. The point of the fixed set is coverage, not tradition. Measurement in particular is the bone quality teams skip and regret, because a calibration drift on the check itself can manufacture a problem that never existed on the line.
Fill every bone before judging any bone
The rule that keeps the session honest: one pass to collect, a second pass to weigh. During collection, the facilitator parks every debate with "noted, second pass," and keeps the causes coming. Mixing the two passes is how dominant voices kill good causes before they reach the grid. Aim for volume first: the examples above run two to three causes per category, which is about right for a focused sixty-minute session with six to ten people.
Ask why twice on every promising cause
A cause you cannot drill into is a symptom wearing a costume. For every candidate that survives the first pass, ask why it happens, then why that happens. "Film lot variance" becomes "lots run hotter in week three" becomes "no incoming check on slip properties." The second why is where root causes live. The 5 Whys columns in the blank version exist for exactly this drill, and a chain that dead-ends at a person is your signal that you blamed instead of asking why one more time.
Attach evidence to every cause you keep
A cause without evidence is a rumor, and a fishbone full of rumors sends the team testing the loudest theory instead of the most likely one. Evidence is cheap at this stage: the reject log by shift, the maintenance record, the film lot numbers, the weather log for the humidity theory. Write it next to the cause in the evidence column. If a cause has no evidence at all after ten minutes of looking, mark it unlikely and move on rather than letting it tie up a test slot.
Test before you fix, and record the verification
The diagram earns its keep after the meeting, in the ranked test list. Pick the cheapest test that discriminates between your top two causes: swap the film lot for a week, retrain one shift and compare, log ambient humidity against rejects. A test that can only confirm one theory is a waste; a test that could clear two is gold. Whatever the outcome, write the verification into the sheet, pass or fail, because the next recurrence starts from that record instead of from a blank whiteboard.
Frequently asked questions
What are the 6M categories in a fishbone diagram?
The six M's are the classic cause buckets: Man, meaning people, training, and fatigue; Machine, meaning equipment condition and maintenance; Method, meaning the process steps and work instructions; Material, meaning raw inputs and their variation; Measurement, meaning gauges, calibration, and the checks themselves; and Mother Nature, meaning environment, weather, and ambient conditions. The 6M variant above carries all six as dropdown values, and the fixed set matters because it forces the team to open every folder instead of camping on the first explanation.
How does a spreadsheet fishbone map onto the drawn diagram?
Same skeleton, different medium. The problem statement is the head of the fish, the category column is the spine, and each row is one bone hanging off its category, with evidence and a likelihood call attached. You lose the picture, which slides sometimes want, and you gain a list you can sort by category, filter to likely causes, and hand to the people running the tests. When you do need the picture for a presentation, one row is one bone, and any diagramming tool will draw the table for you.
What is the difference between a fishbone and a 5 Whys analysis?
A fishbone is wide: it collects candidate causes across every category before committing to any of them. The 5 Whys is deep: it takes one cause and drills why, then why again, until the chain bottoms out at something fixable. Strong analyses run wide first and deep second, which is why the blank causes variant above carries two why columns next to each cause, and why the how-to on this page tells you to ask why twice on every cause that survives the first pass.
How is a fishbone diagram different from a process map?
A process map describes how work is supposed to flow, step to step with owners and handoffs. A fishbone diagram asks why one specific output of that flow is going wrong. They are complementary: the process map shows you where a failure step sits in the flow, and the fishbone opens that step up to find what inside it, or feeding it, is breaking. Teams often pin the fishbone head to a step name straight out of the process map, which is why the two templates pair well on the same problem.
How many causes belong on a fishbone diagram?
Enough to cover every category, and few enough to test. For a focused session with six to ten people, two to four causes per category is the right grain, which lands the total between twelve and twenty. Fewer means someone left a bone empty, and the empty bone is rarely empty in reality. More means the team is listing everything conceivable instead of everything plausible, and the test list downstream will drown. The categorized variant above is the antidote: one most likely per category, and the rest parked.
What do I do after the fishbone session ends?
Convert the diagram into a test plan the same day, while the reasoning is fresh. Rank the likely causes by cheapest test first, assign an owner and a date to each, and write the verification method next to the cause, not in a separate email. The categorized and root cause variants above carry test and verification columns for exactly this handoff. A fishbone that stays a diagram is a meeting souvenir; the same content as a ranked test list is how the seal failures actually stop.
Should we draw the fishbone by hand or build it in a spreadsheet?
Draw it by hand or on a whiteboard during the session, because the diagram shape matters while causes are being surfaced and people think in branches. Then transcribe the result into a spreadsheet the same day, because the follow-through, ranking, owners, and verification dates, only happens in a format that sorts and filters. The spreadsheet versions above mirror the diagram structure: one row per cause with its category, so the table reads like the fishbone reads. Teams that skip the transcription step almost always lose the reasoning when the whiteboard gets erased, and end up rerunning the same exercise a quarter later with the same list.
Run it live instead of in a file.
The downloads above are yours either way. In Wisegrid the same template becomes a working sheet with owner contacts, status dropdowns, reminders, and dashboards. 7-day free trial, no credit card required.