Construction Project Dashboard: The Best Way to See Every Job in 2026
A construction project dashboard is the one-screen view of a job’s vital signs: schedule progress against baseline, budget versus committed versus actual cost, open and aging RFIs and submittals, approved and pending change orders, and safety incidents. It exists so that a superintendent, a project manager, and an owner can look at the same screen and agree on where the job stands, without anyone reconciling three spreadsheets first.
The dashboard is only as good as the trackers behind it. Construction data lives in logs: a budget sheet coded by cost code, a change order log, an RFI log, a short milestone schedule. The downloads below are those working trackers, pre-filled with realistic example data, and this page walks through how to wire them into a dashboard that stays current instead of becoming one more report somebody assembles the night before the meeting.
Construction tracker templates, free to download
Each download below is one of the working logs a dashboard reads from, pre-filled with realistic example rows so you can see what a well-kept log looks like before you clear it for your own job. Every file is a garden-variety spreadsheet, equally happy in desktop Excel or a browser tab. No email address required.
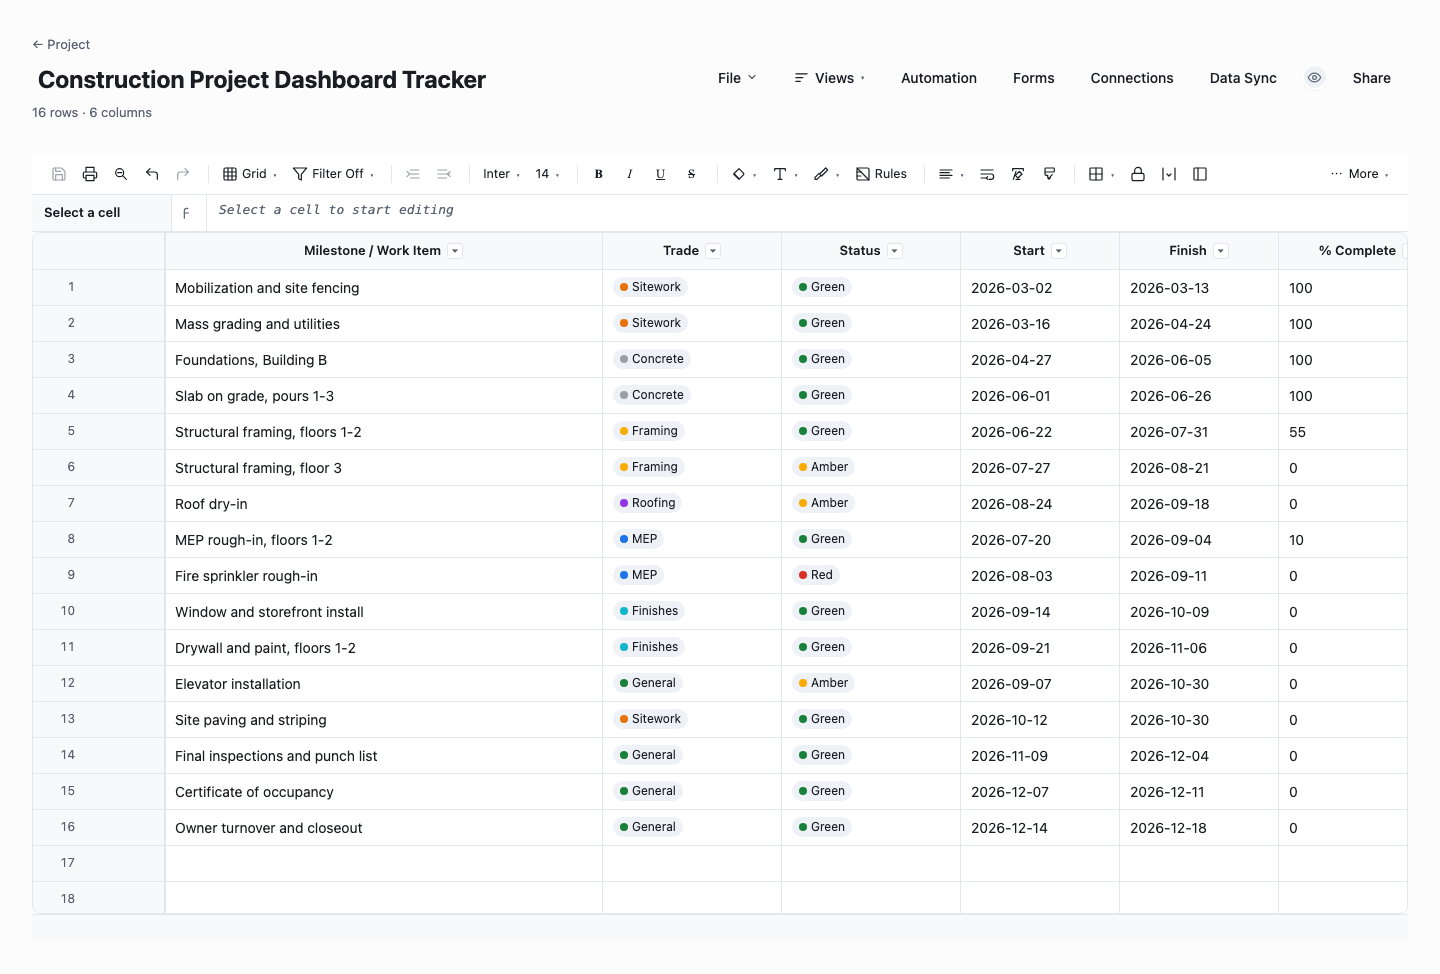
Construction Project Dashboard Tracker
The dashboard tracker is the data sheet the dashboard reads: milestones and work items tagged by trade, each with a RAG status, start and finish dates, and percent complete. Use it as the single working schedule the superintendent updates, because a dashboard is only as honest as the sheet behind it. Grouped by trade it runs the sub coordination meeting. Filtered to red items, it runs the owner call.
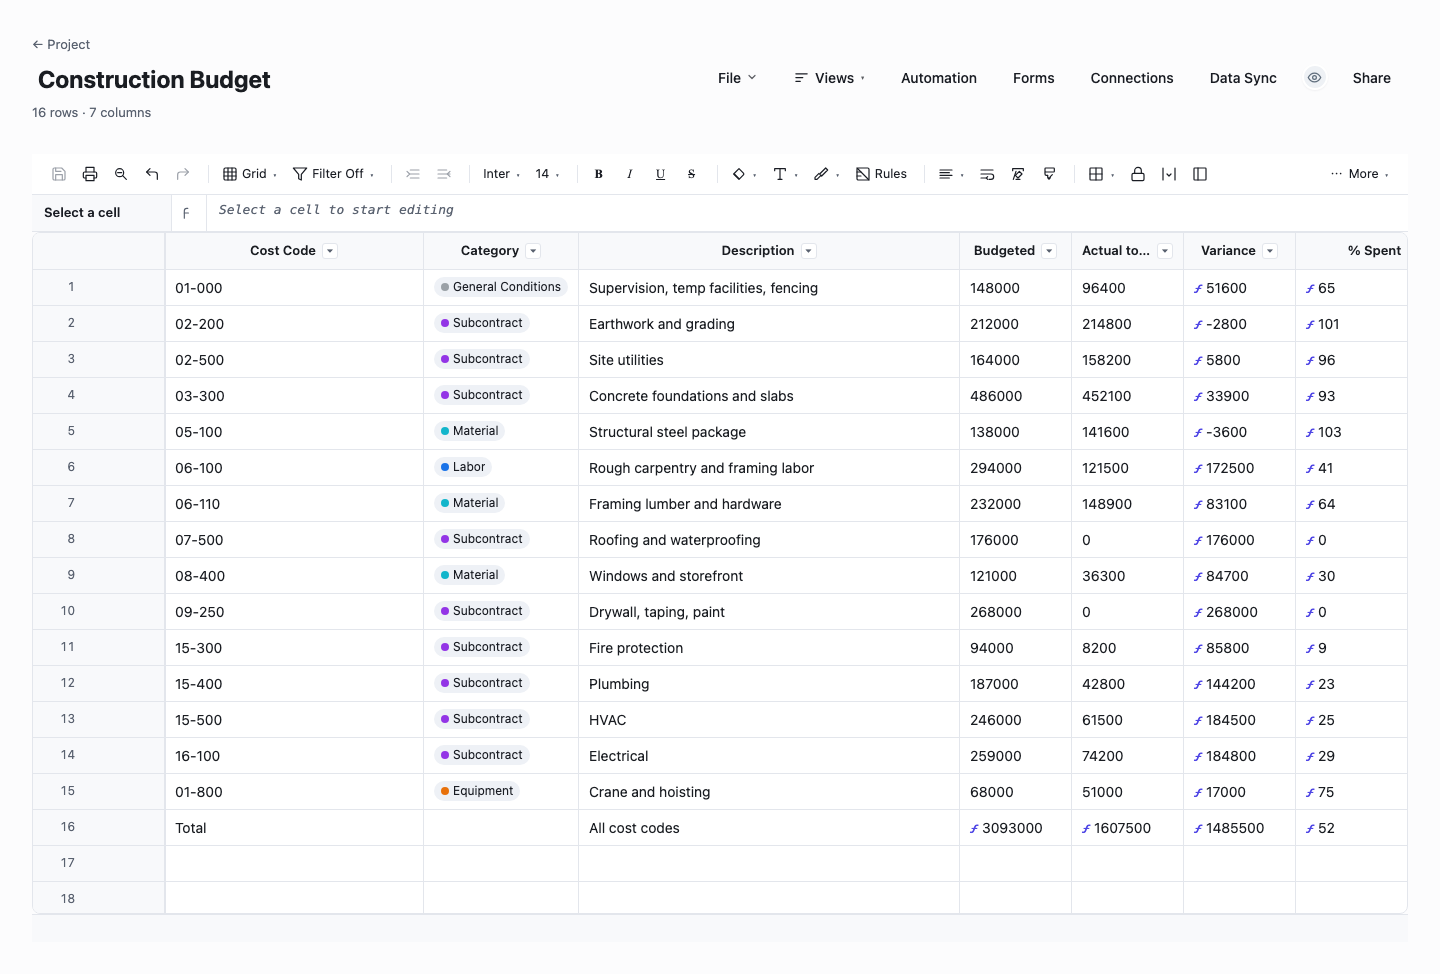
Construction Budget
The construction budget is a cost-code budget with live math: budgeted, actual to date, variance, and percent spent per line, with a totals row summing the whole job. Use it as the money half of the dashboard, reviewed against the schedule every week, because overruns caught at twenty percent spent are line-item conversations while overruns caught at ninety percent are project crises. The cost-code column is what lets this sheet reconcile cleanly with your accounting system.
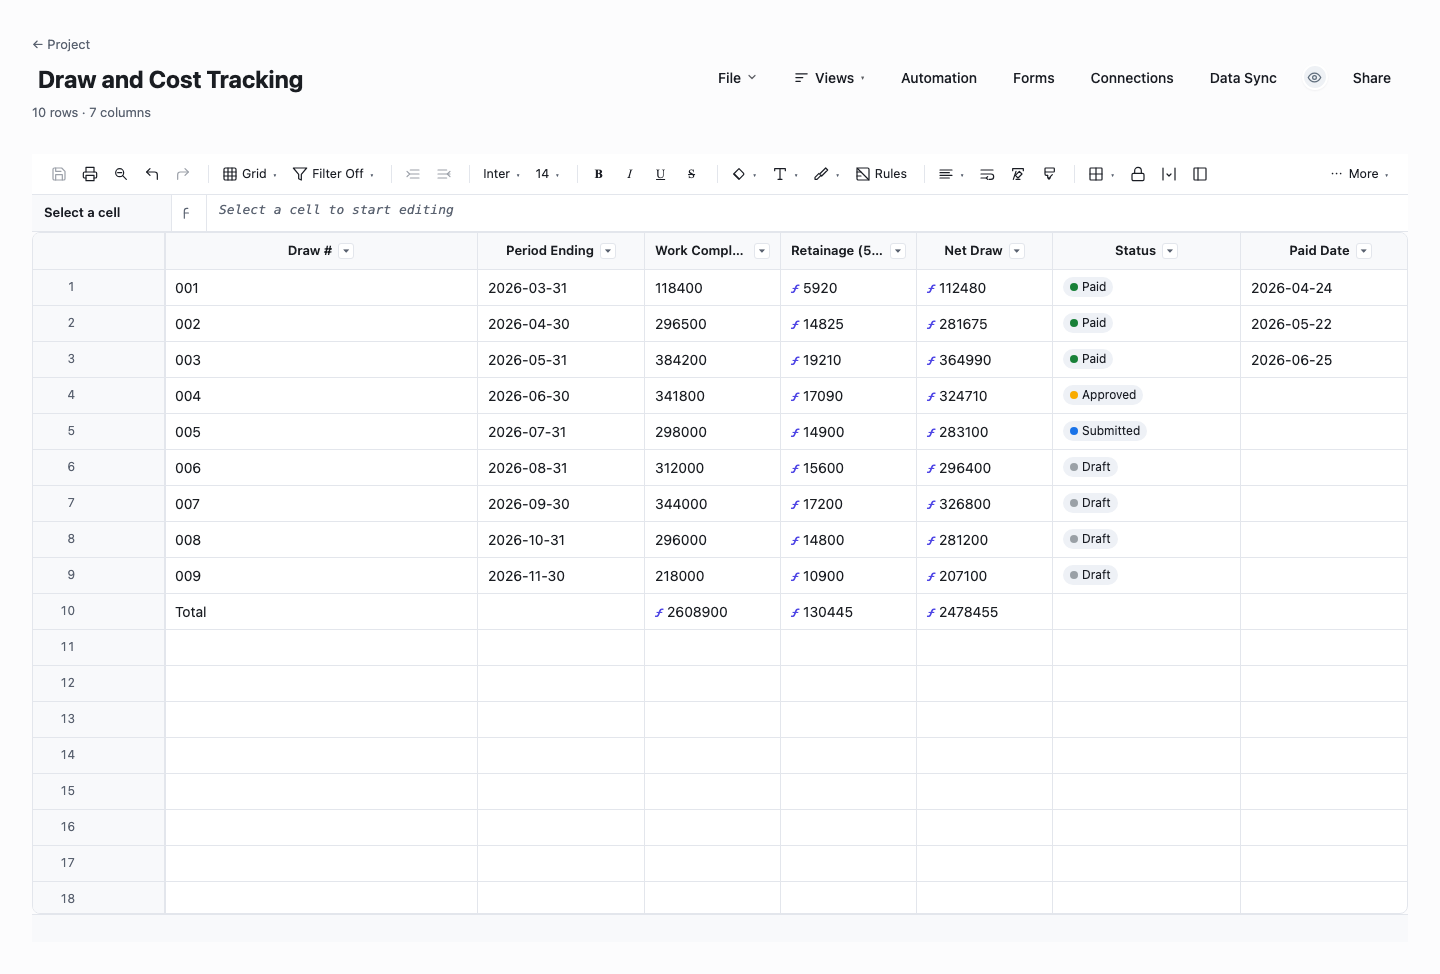
Draw and Cost Tracking
The draw tracker follows the cash: each pay application with its period, work completed, retainage computed live at the contract rate, the net draw, and its status through submission and payment. Use it on any job billed through scheduled draws, because billed-to-date and paid-to-date are the two numbers that keep a contractor solvent, and a tracker that computes them automatically means the answer never depends on finding last month’s spreadsheet.
How to build a construction project dashboard that stays current
Pick the six numbers a super and an owner both need
Start from the questions the weekly meeting always asks: are we on schedule, what will the job finally cost, what changed, what are we waiting on, and is anyone getting hurt. That resolves to a short list: percent complete versus baseline, budget versus committed versus actual, approved change order total, open RFI count with the age of the oldest, submittal status, and recordable incidents. Everything else is drill-down. A dashboard that tries to show everything gets ignored as reliably as a report nobody opens.
Build the budget sheet first, coded by cost code
The budget tracker is the spine of the dashboard. Give every line a cost code (CSI divisions or your own scheme), the original contract value, approved changes, projected final cost, committed cost, and actual cost to date. Keep the codes consistent with your accounting system so the numbers reconcile instead of competing with it. Once the budget rows are clean, the money widgets are just sums and differences over this one sheet.
Wire the schedule to a short milestone list
The dashboard does not need the full CPM schedule, only the fifteen to thirty dates that define the job: permits, mobilization, foundation complete, dry-in, rough-in inspections, substantial completion. Track each with a baseline date, a current forecast, and a status, and let the variance compute itself. When the forecast column moves, the dashboard shows the slip the same day, not at the next monthly schedule update.
Treat change orders as line items, not paperwork
Log every change event the day it appears: number, description, cost impact, schedule impact, and a status running from pending through approved to incorporated. Two totals belong on the dashboard: approved changes, which set the revised contract value, and pending changes, which are the exposure. A job that looks on-budget while carrying six figures of pending change orders is not on budget, and the dashboard should make that visible without anyone asking.
Age your RFIs and submittals
An RFI log earns its place on the dashboard through the age column: days open, computed from the date raised, with the ball-in-court noted per item. Old RFIs are where schedule slips incubate, because a question nobody answers becomes a crew standing down a month later. Show the count of open items and the age of the oldest, and review anything past your response threshold by name in the weekly meeting.
Run the dashboard in the weekly OAC meeting
A dashboard that is not the agenda dies. Open it in the weekly owner-architect-contractor meeting and walk it top to bottom: schedule variance, money, changes, open items, safety. When the meeting runs off the same screen the team updates, the updates happen, because stale numbers get caught in public. That feedback loop, not the widgets, is what keeps a dashboard alive.
Keep updates cheap enough to actually happen
Every number on the dashboard should be maintained in exactly one log by one named owner, and the dashboard should read the logs rather than being edited itself. If updating status means editing a slide deck, it will be skipped in busy weeks, which are precisely the weeks that matter. In a live sheet the rollups recompute as the logs change, so the dashboard is simply always current.
Watch: a construction dashboard from scratch
The construction budget template behind the dashboard
Most searches for a construction budget template are really looking for the budget log a dashboard needs anyway: one row per cost code carrying the original contract value, approved change orders, revised contract, committed cost, actual cost to date, and projected final cost. The projected final column is the one that earns its keep, because it is where known overruns surface weeks before they reach an invoice.
Two disciplines keep the sheet honest. First, committed cost means signed subcontracts and issued purchase orders, not estimates, so the gap between budget and committed is real exposure rather than hope. Second, retainage is tracked but not spent: the five or ten percent held back from progress payments is not margin, and folding it into cash figures flatters a struggling job. Give it a column of its own.
The budget download above ships with example cost codes and live formulas for revised contract, variance, and percent billed, so the math is already wired when you replace the example rows with your own job.
Rolling one job up to a portfolio view
Once a single job runs on clean logs, the multi-project view is the same trick repeated: every job reports the same six numbers, and the portfolio dashboard is a table with one row per job showing percent complete, projected final versus contract, pending change exposure, oldest open RFI, and the next milestone. A GC running eight jobs reads that table in under a minute and knows where to spend the afternoon.
The discipline that makes the rollup possible is consistency, not sophistication. Same cost code scheme on every job, same milestone naming, same change order statuses. When each project manager invents their own categories, the portfolio view degenerates into a wall of footnotes, and the office falls back to calling each PM for the real story, which is the situation the dashboard existed to end.
Start small: pick the two or three numbers the owner of the company actually checks, get every active job reporting them the same way, and grow the table from there. A thin portfolio view that is always right beats a rich one that is usually stale.
Frequently asked questions
What should a construction project dashboard show?
Schedule health against baseline, budget versus committed versus actual with a projected final cost, approved and pending change order totals, open RFIs and submittals with aging, and safety numbers. Those five blocks answer the questions every owner meeting asks. Anything deeper, the task-level schedule, the full cost history, the drawings, belongs one click down in the logs, not on the dashboard itself.
What is the difference between a dashboard and a project report?
A report is a snapshot someone assembles for a moment in time. A dashboard is a live view that shows whatever the logs say right now. Reports still have a place, for the record and for stakeholders who want a narrative, but the dashboard is what keeps the team from spending Sunday night rebuilding the morning report. When the logs are kept current, the report becomes an export of the dashboard rather than a separate chore.
How do contractors track a construction budget?
By cost code. Every dollar of estimate, commitment, and actual cost is tagged to a code, commonly based on CSI MasterFormat divisions, so the same code rolls up from the subcontract to the invoice to the budget line. The working questions are then simple: what did we budget for this code, what have we committed, what have we spent, and what will it finally cost. Overruns become conversations per code instead of one scary total.
What is retainage in construction?
Retainage is the portion of each progress payment, typically five to ten percent, that the owner withholds until the work is complete and accepted, as security for performance and defect correction. It matters on a dashboard because it distorts naive cash math: a job can show healthy billings while a meaningful slice of them is not collectible until closeout. Track billed, paid, and retained as separate columns so the true position is visible.
How often should dashboard numbers update?
As often as the underlying logs change: change orders and RFIs the day they move, budget actuals when invoices post, which is weekly on most jobs, and milestone forecasts as soon as the field knows a date moved. The dashboard itself should never be updated as a task. It should read the logs. If your dashboard requires a weekly assembly session, that session is the first thing worth automating away.
Do I need construction software, or can spreadsheets handle this?
For a single job or a small portfolio, well-kept sheets genuinely do the work: the logs above are spreadsheets and the math is ordinary arithmetic. What breaks first is not calculation but coordination: multiple people editing files, emailed copies drifting apart, nobody certain which version is real. That is the point where moving the same logs into a shared live grid pays for itself, because the structure stays identical while the version problem disappears.
Is this construction dashboard template free to download?
Yes. All three versions download as .xlsx files with no email gate and no signup: a milestone tracker by trade with percent complete, a budget sheet by cost code with variance math, and a draw tracker with retainage and net-draw columns. Each ships pre-filled with realistic rows so the structure reads at a glance before you swap in your own job.
How should change orders show up on a construction dashboard?
Two totals, kept separate: approved change orders, which have already moved the contract value, and pending ones, which are exposure that has not landed yet. Lumping them together is how a job reads healthy right up to the month the pending pile gets approved. Show the count alongside the dollars, because eleven small pending change orders tell a different story than one big one, even at the same total.
Run it live instead of in a file.
The downloads above are yours either way. In Wisegrid the same template becomes a working sheet with owner contacts, status dropdowns, reminders, and dashboards. 7-day free trial, no credit card required.