Capacity Planning Template: The Best Way to Balance Team Workload in 2026
A capacity planning template is a spreadsheet that answers the question every planning meeting dances around: how much work can this team actually take on? It lists each person, their real available hours for the period, and the demand already claimed by projects and run-the-business work, then compares the two so the gap is a number instead of a feeling.
The comparison matters because teams do not fail at estimating work; they fail at counting availability. Plans quietly assume forty productive hours a week from people who also attend meetings, take leave, support last quarter’s launch, and occasionally get sick. A capacity plan built on net hours, not headcount, is routinely the difference between a stretch goal and a fiction.
Capacity planning templates, free to download
Each version below is a working spreadsheet with realistic people and projects, plus live formulas for the FTE and utilization math, so you can see a finished capacity plan before you build your own. Each file is standard spreadsheet format, so it behaves the same whether your planning lives in Excel, Google Sheets, or something else entirely. No email address required.
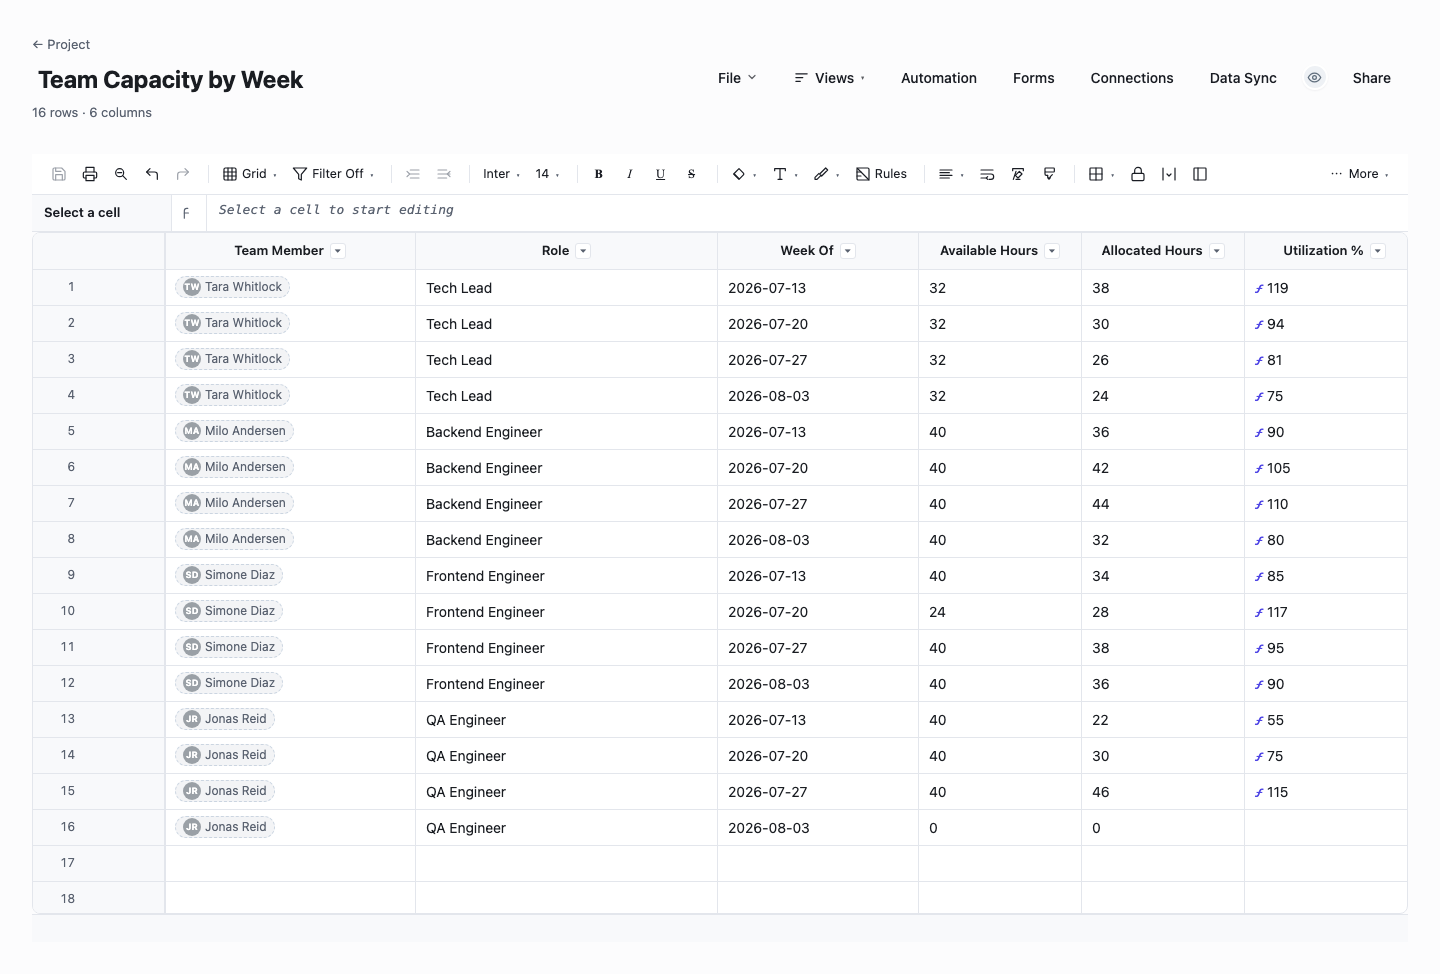
Team Capacity by Week
The week-by-week version is the working heart of capacity planning: each row is one person in one week, with available hours, allocated hours, and a utilization percentage computed live. Use it for the rolling four-to-eight week view where staffing problems are still fixable, because an overloaded week shows up as a number over 100 while there is still time to move work. It is also the version to start with if capacity planning is new to your team, since it forces the honest availability conversation person by person.
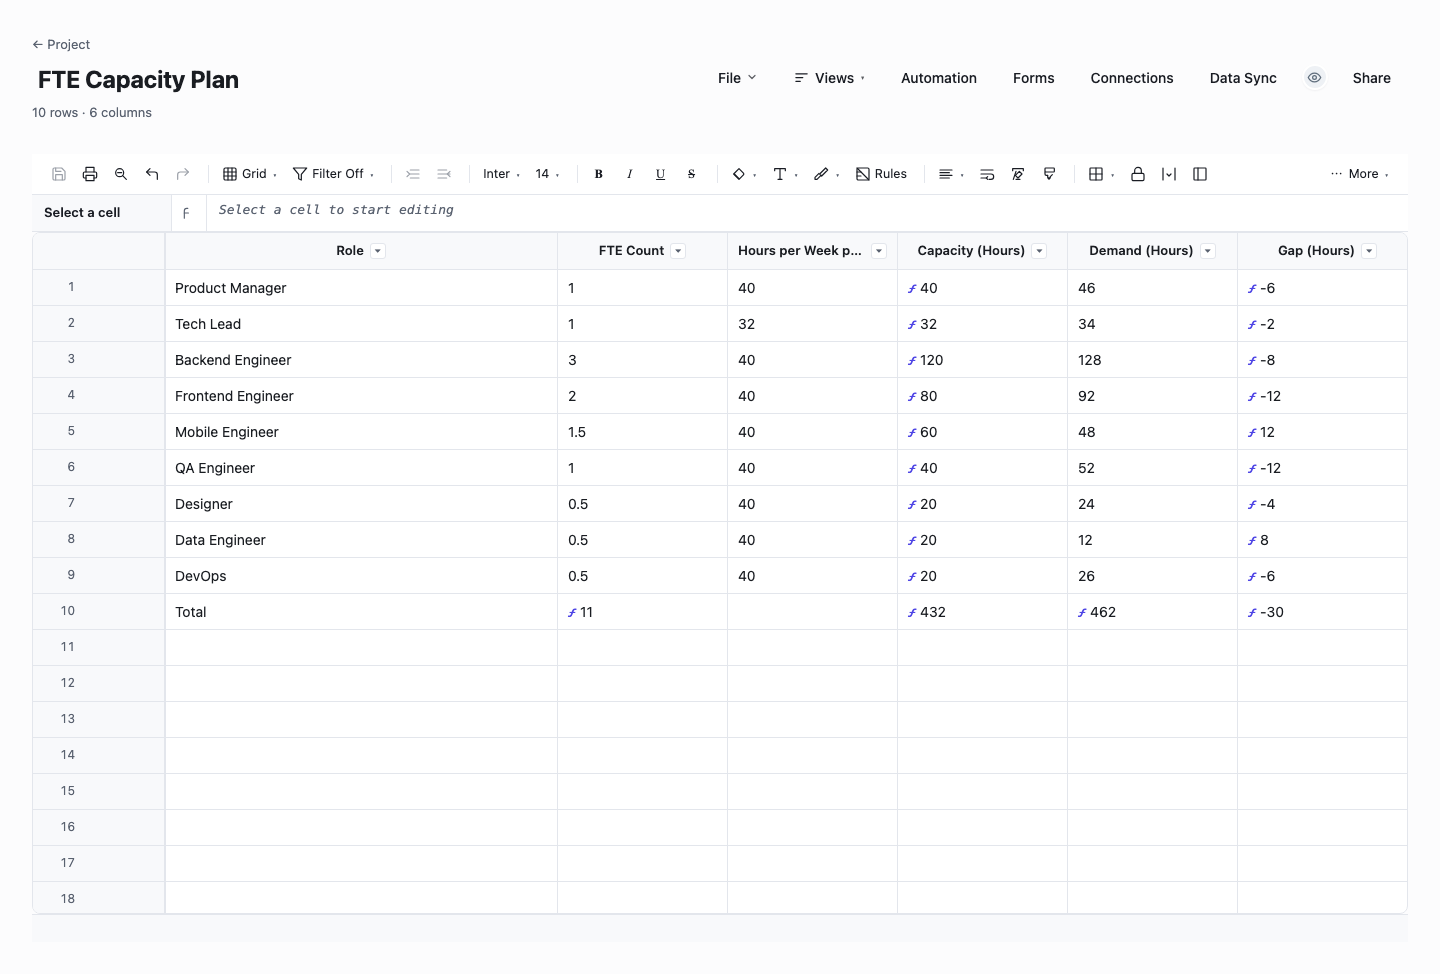
FTE Capacity Plan
The FTE capacity plan works at the role level instead of the person level: headcount entered as FTEs, hours per week per FTE, and live capacity, demand, and gap columns per role. Use it for quarterly planning and hiring cases, where the question is not who is busy next week but whether you have enough engineers, designers, or analysts at all. A gap column that computes itself is the fastest way to turn a staffing complaint into a staffing case.
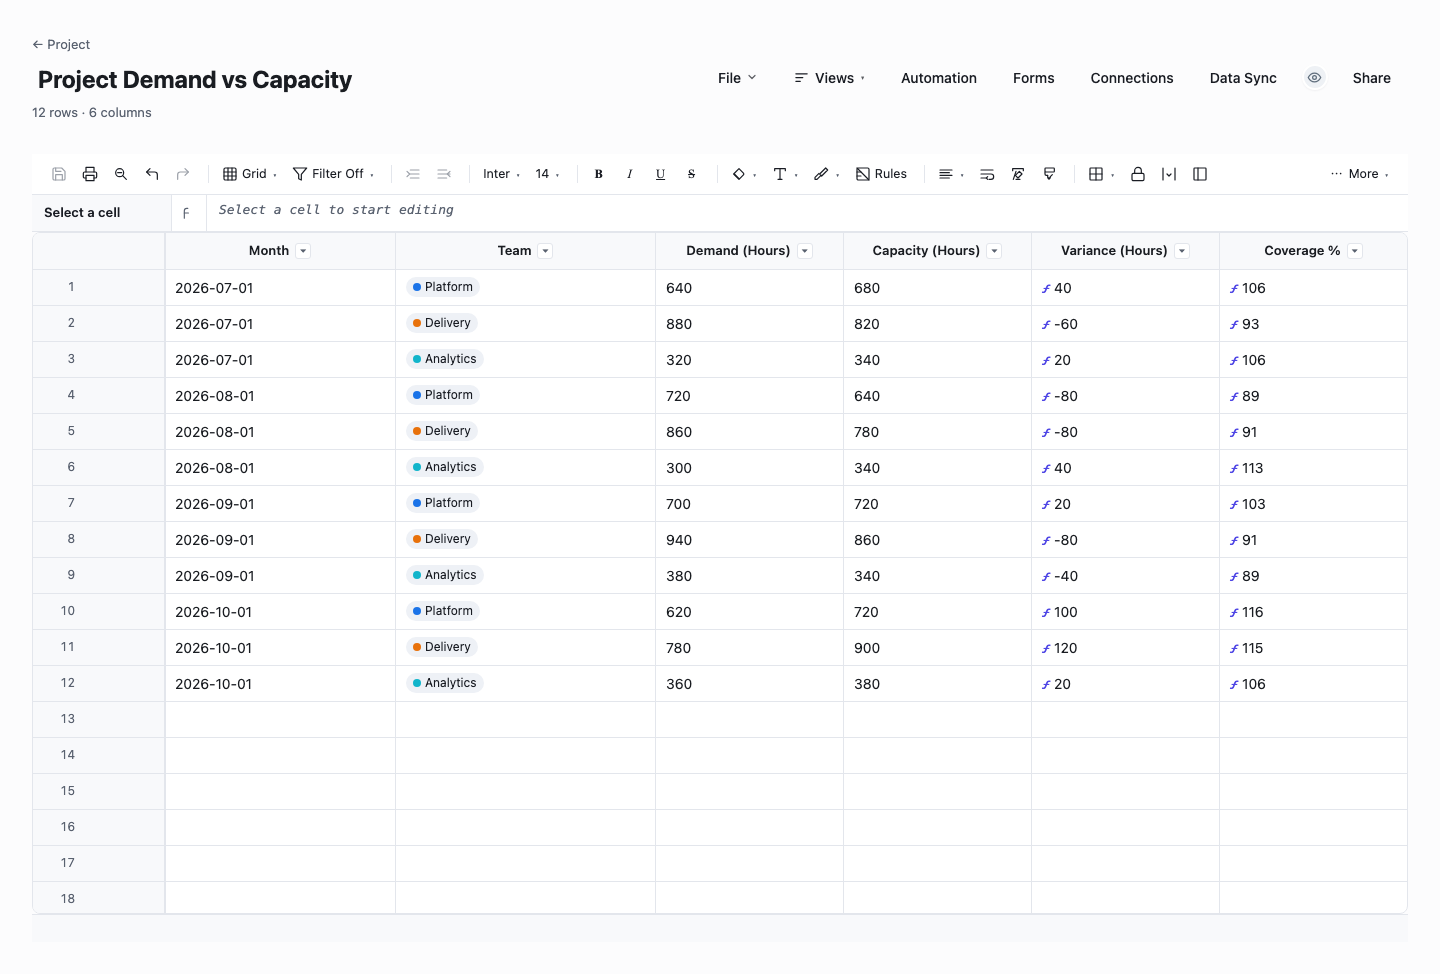
Project Demand vs Capacity
The demand-versus-capacity view looks forward by month: incoming project demand in hours against team capacity, with variance and coverage percentage computed live. Use it when you own intake decisions, because it answers the question every new request should trigger: when does demand outrun the team, and by how much. Plotting the coverage column over the next two quarters is usually all it takes to make a delay-or-hire decision concrete.
How to build a capacity plan the team believes
List people, not roles
Start with the actual humans on the team, one row each, not "2x engineer, 1x designer". Real people have part-time contracts. They take leave. They get split across teams. Those details are precisely where capacity plans go wrong. A plan built on abstract roles inherits nobody’s calendar and everybody’s optimism.
Record contracted hours and convert to FTE
Note each person’s contracted hours per week and their share available to this team, then express it as an FTE fraction so different arrangements become comparable. Someone full-time on paper but half-allocated to another product line is 0.5 FTE here, and writing that down is how the plan stops silently double- booking them. The templates compute the fraction from the hours you enter.
Cut gross hours down to net hours
Subtract the time that is never available for project work. Public holidays. Booked leave. A realistic meeting and administration load, which for most teams runs fifteen to twenty five percent of the week. What remains is net capacity, the only number worth planning against. Teams that plan against gross hours run at a built-in overcommitment before the first task is assigned.
Log demand per project in the same units
List every claim on the team for the period: projects, support rotations, maintenance, and the recurring work that never appears on a roadmap. Estimate each in hours (or days consistently) per person or per skill, and keep the granularity coarse. Capacity planning needs honest tens of hours, not falsely precise halves. Unlogged demand does not disappear, it just gets taken out of evenings.
Compare, and read the utilization line
The template divides demand by net capacity per person and per team, and the reading is simple: under about eighty five percent there is slack for the unplanned, near one hundred the plan has no shock absorber, and over it someone is already working the overage. The point of the sheet is to have this argument in planning, with numbers, instead of in a retrospective, with apologies.
Rebalance with moves, not exhortation
When a person or skill is over capacity, the fixes are concrete: move work to whoever has slack, slide dates, cut scope, or hire. "We will just push harder" is not a rebalancing strategy, it is a deferred incident. Make the chosen fix visible in the sheet by moving the hours, so the plan and the promise stay the same document.
Refresh it on a cadence, briefly
Capacity is perishable: leave gets booked, people join and go, projects overrun their estimates. Re-walk the sheet monthly for a quarterly plan, or at each sprint boundary for iterative teams, updating only what changed. Fifteen minutes on a rhythm keeps the plan trustworthy. A quarterly heroic rebuild means the sheet was dead for ten of thirteen weeks.
Watch: capacity planning in 2 minutes
FTE, explained in one paragraph (and why capacity math uses it)
FTE stands for full-time equivalent: one FTE is one person working a full-time schedule, and every other arrangement is a fraction of it. A twenty-hour contract against a forty-hour week is 0.5 FTE; ten people at half time are five FTE and ten headcount. Capacity math runs on FTE and hours rather than heads because headcount flatters the plan: it counts people who are half allocated, on leave, or shared with another team as if they were whole. If you want the arithmetic without the spreadsheet, our free FTE calculator does the same conversion in the browser, and the templates above carry the identical formula in the availability columns.
A worked example makes the difference concrete. A team of six reads as six headcount, but suppose one is a twenty-hour part-timer (0.5), one is lent half-time to another product (0.5), and one starts mid-quarter (0.6 for the period). The team is 5.1 FTE at best, and if the standard week is forty hours, the quarter holds roughly 2,650 gross hours rather than the 3,120 a headcount plan would assume. That fifteen percent gap is invisible in every meeting where someone says "we have six people", and it is the first thing the template makes you write down.
Working days, holidays, and the hours that survive
Gross capacity is contracted hours times the weeks in the period. Net capacity is what survives contact with the calendar: remove weekends, public holidays, booked leave, and the standing meeting load, and a "40-hour" week yields something closer to twenty eight to thirty two plannable hours. Over a quarter the gap compounds. A five-person team loses several person-weeks to holidays alone, which is an entire small project the gross plan thought it had.
The working-day count is exactly what spreadsheet NETWORKDAYS formulas exist for, and the templates above use them with a holiday list you edit for your region. For a quick answer without opening the file, the free working days calculator linked below runs the same NETWORKDAYS math for any date range and holiday set, in the browser.
Two practical rules keep the net-hours math honest. Count leave that is booked, not leave that might be taken, and revisit at each refresh. Guessing annual leave up front just moves the error around. And measure the meeting load once instead of debating it: pick a typical week, add up the standing commitments for each role, and use that number until reality changes it. Teams are consistently surprised by this figure, and the surprise is the point.
Frequently asked questions
What is capacity planning in project management?
Capacity planning is matching the work a team is asked to do against the hours it will really have once the calendar is done with them, before committing to dates. It converts people into available hours (via FTE and net working-day math), converts the roadmap into demanded hours, and compares the two per person, per skill, and per team. The output is an early decision: rebalance, rescope, reschedule, or hire, made while it is still cheap.
What is FTE and how is it calculated?
FTE, full-time equivalent, expresses working time as a fraction of a full-time schedule: hours worked divided by full-time hours. Thirty hours against a forty-hour standard is 0.75 FTE, and a team’s FTE total is the sum of everyone’s fractions. It exists so budgets and capacity plans can compare mixed arrangements of full-timers, part-timers, and shared people in one honest unit instead of counting heads.
What is the difference between capacity planning and resource planning?
Capacity planning is the aggregate question: does the team have enough hours for the demand this quarter? Resource planning (or resource allocation) is the assignment question: which named person works on which project next week? Capacity planning runs first and coarser, and resource planning executes its answer at the level of individuals and dates. The template above does the first and gives you the per-person numbers the second needs. Skip it and resource planning becomes assigning work the team never had room for in the first place.
How far ahead should you plan capacity?
One planning horizon further than your commitments. A team that commits quarterly should hold a rolling one-to-two-quarter capacity view. A team on two-week sprints needs precise numbers for the next sprint and a rough shape for the next six. Past that, precision is theater, because leave and attrition will rewrite it, and so will whatever new work lands next quarter. Plan coarsely far out, precisely close in, and refresh on a fixed cadence.
Can I use velocity instead of hours for capacity planning?
Yes, with a substitution: if a stable team plans in story points, its recent velocity already is a capacity model, and you should plan the sprint against it rather than hours. The hours-and-FTE view stays useful exactly where velocity goes blind: people split across teams, long leave, hiring plans, or any question an executive asks in person-weeks. Many teams run velocity inside the sprint and an FTE-based plan above it.
What utilization rate should a team plan for?
Plan project load to roughly seventy to eighty five percent of net capacity and treat the remainder as the shock absorber for support, rework, and the unplanned work that always arrives. Sustained planning at one hundred percent guarantees the first surprise becomes a slipped date, and sustained actuals above it are a burnout signal, not a productivity win. If utilization is chronically low instead, the demand log is usually missing work, not the team missing effort. Utilization is a planning guardrail, not a performance metric, and the day it becomes a target is the day the numbers in the sheet stop being honest.
Run it live instead of in a file.
The downloads above are yours either way. In Wisegrid the same template becomes a working sheet with owner contacts, status dropdowns, reminders, and dashboards. 7-day free trial, no credit card required.