Build a RAID log in Wisegrid
A RAID log is one sheet that tracks the four things that quietly kill projects: Risks, Assumptions, Issues, and Dependencies. This guide builds a RAID log that maintains itself: entries age visibly, stale items escalate on their own, and one dashboard answers "what is open and how bad is it" without anyone compiling a status deck. Everything here is included in your plan. New to the concept? Start with what a RAID log is, with the columns and a worked example; this guide is the hands-on build.
Create the sheet with the RAID structure
Create a new sheet and give each column a real type. Types are what make the rest of this guide possible: a dropdown can drive formatting rules, a contact column can receive alerts, and date columns feed the automation.
Click the caret on each column header to open Column details and set the type and, for dropdowns, the choices:
- Type: Dropdown with the choices
Risk,Assumption,Issue,Dependency. - Title and Detail: Text.
- Owner: Contact. Every entry needs a human attached, and the automation in step 4 will email whoever is in this column.
- Severity: Dropdown with
Low,Medium,High,Critical. - Status: Dropdown with
Open,Mitigating,Closed. - Raised and Review by: Date.
Enter a few real entries as you build. Formatting rules and widgets are much easier to sanity-check against rows you recognize.
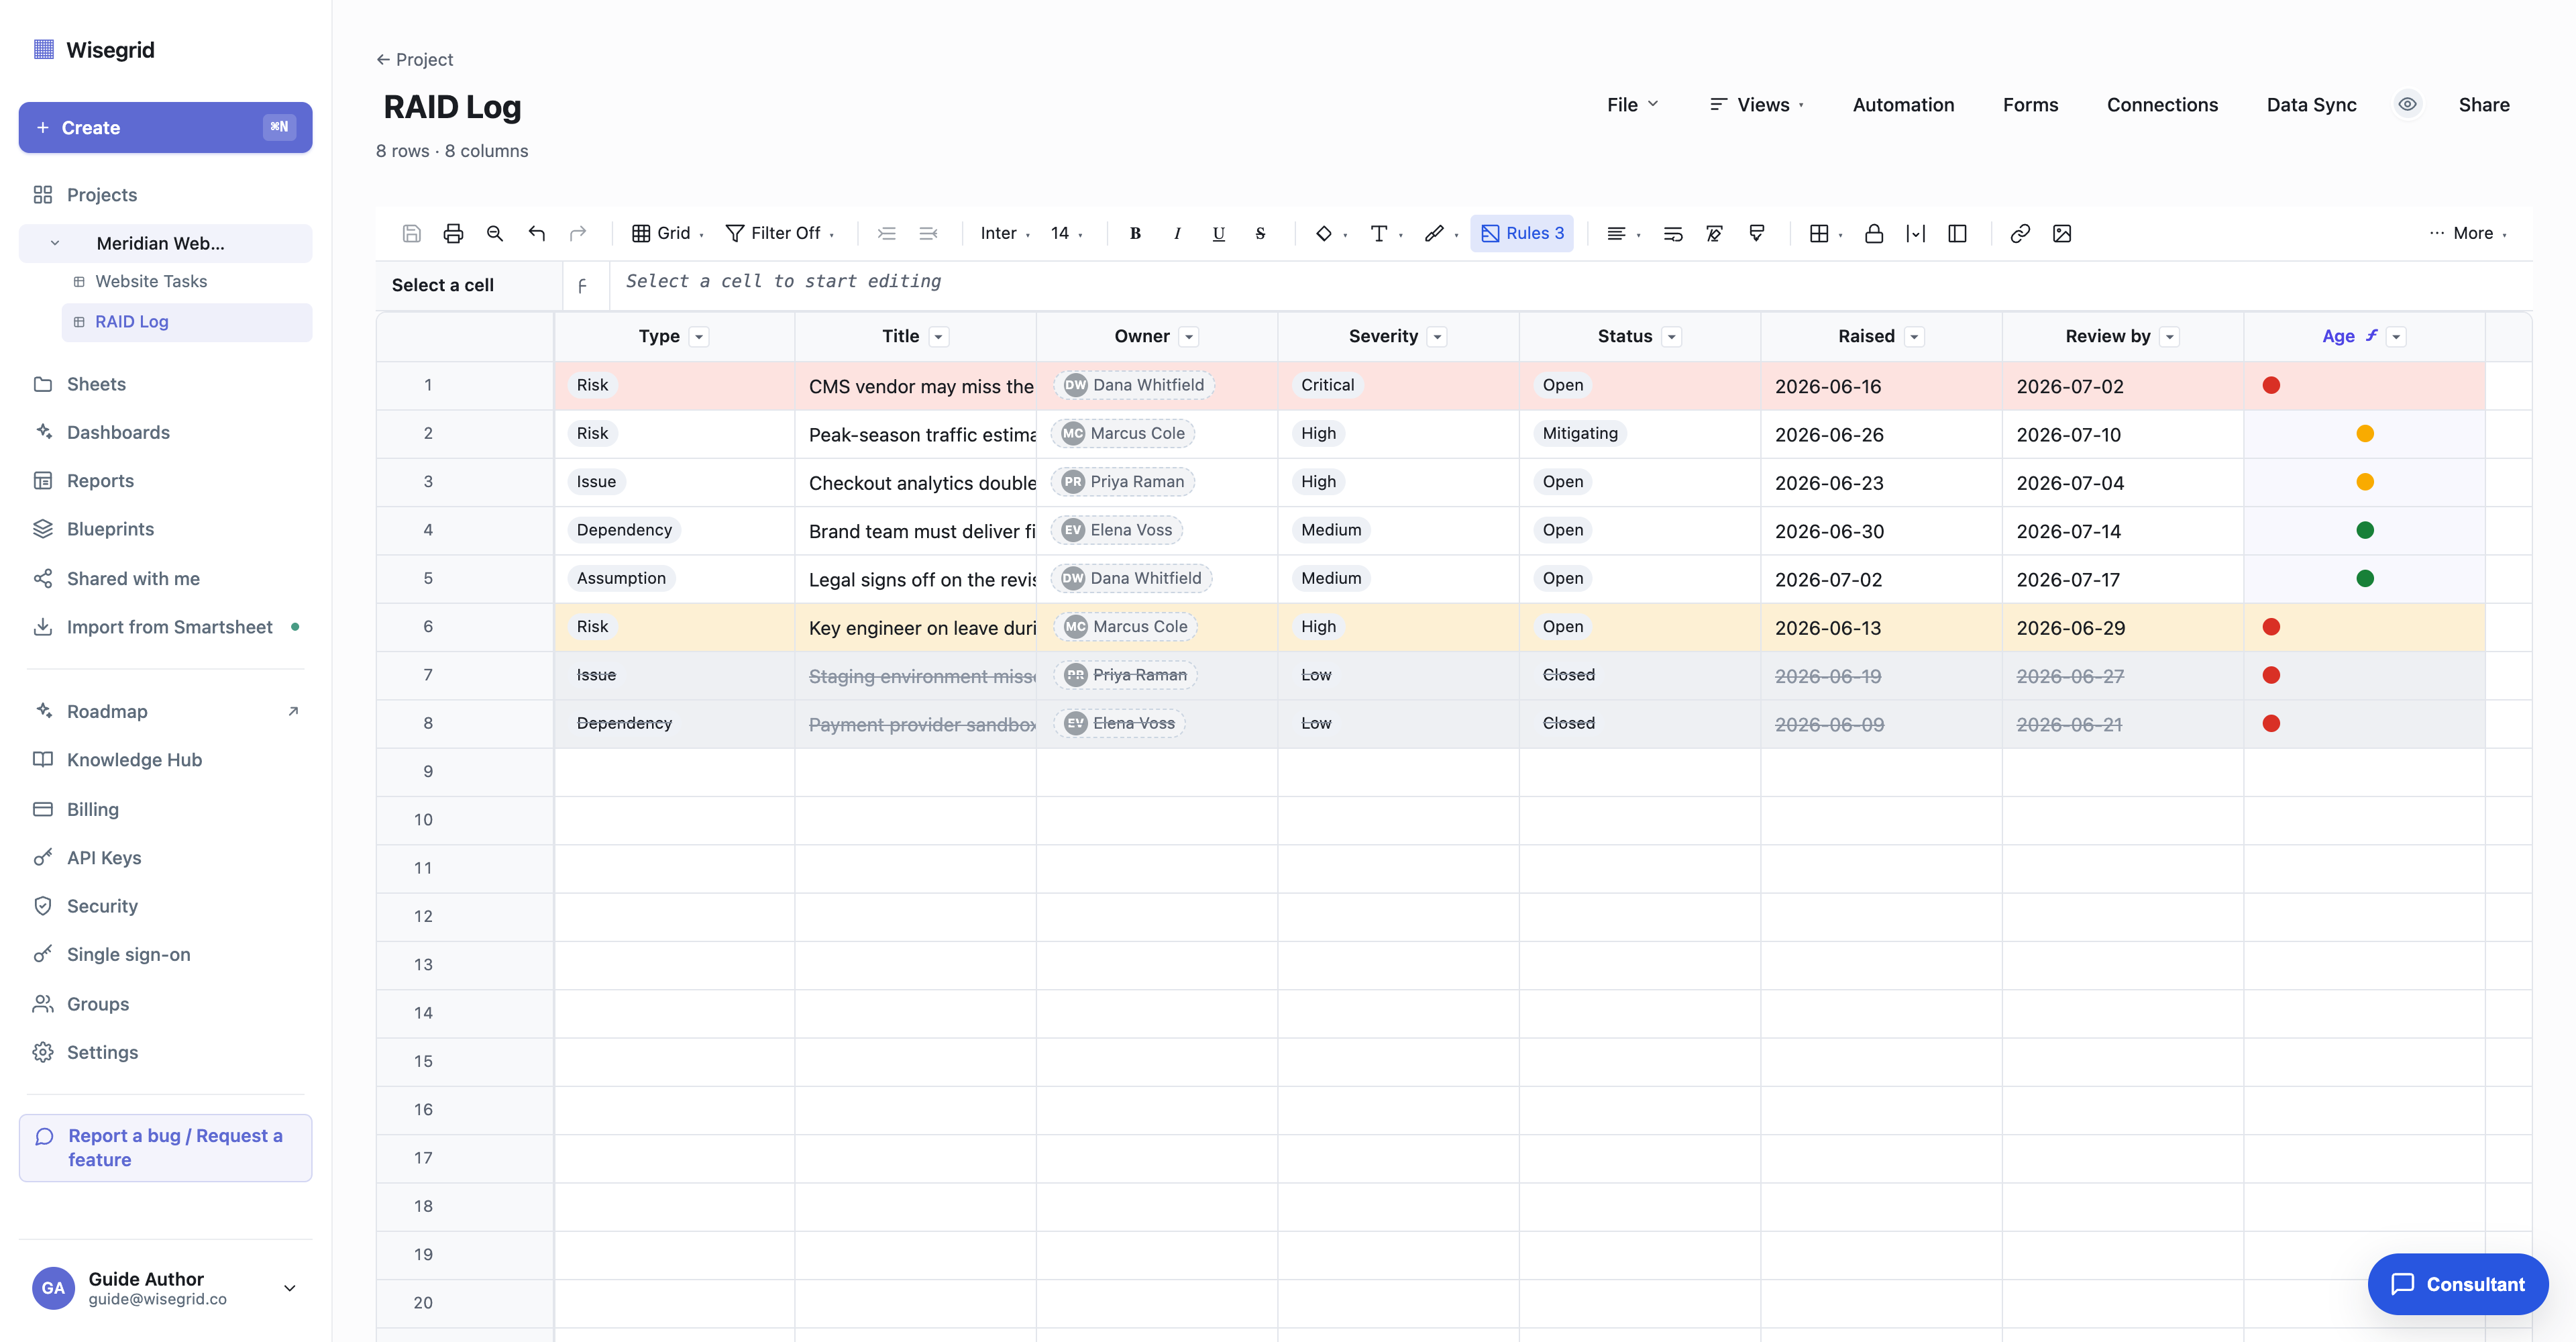
Add a self-updating age flag
Risks rot quietly. The classic failure is a "High" risk raised six weeks ago that nobody has looked at since. Give the sheet a column that measures that drift by itself.
Add a Symbol column named Age and give it a column formula, so every row computes its own flag:
=IF(ISBLANK([Raised]@row), "", IF(TODAY() - [Raised]@row > 14, "red", IF(TODAY() - [Raised]@row > 7, "yellow", "green")))Date math is native: TODAY() - [Raised]@row is simply the number of days the entry has been open. Entries show a green dot for their first week, go yellow after 7 days, and red after 14 (and the ISBLANK guard keeps unused rows unflagged). The formula re-evaluates as time passes, so the flags stay honest with zero upkeep.
If you would rather not type a formula, a Symbol column's guided status rule builder writes it for you: you describe the rule ("make this dot update itself based on other columns") and pick the conditions.
Formulas, symbol columns, and status rules are included in your plan.
Make the sheet color itself with conditional formatting
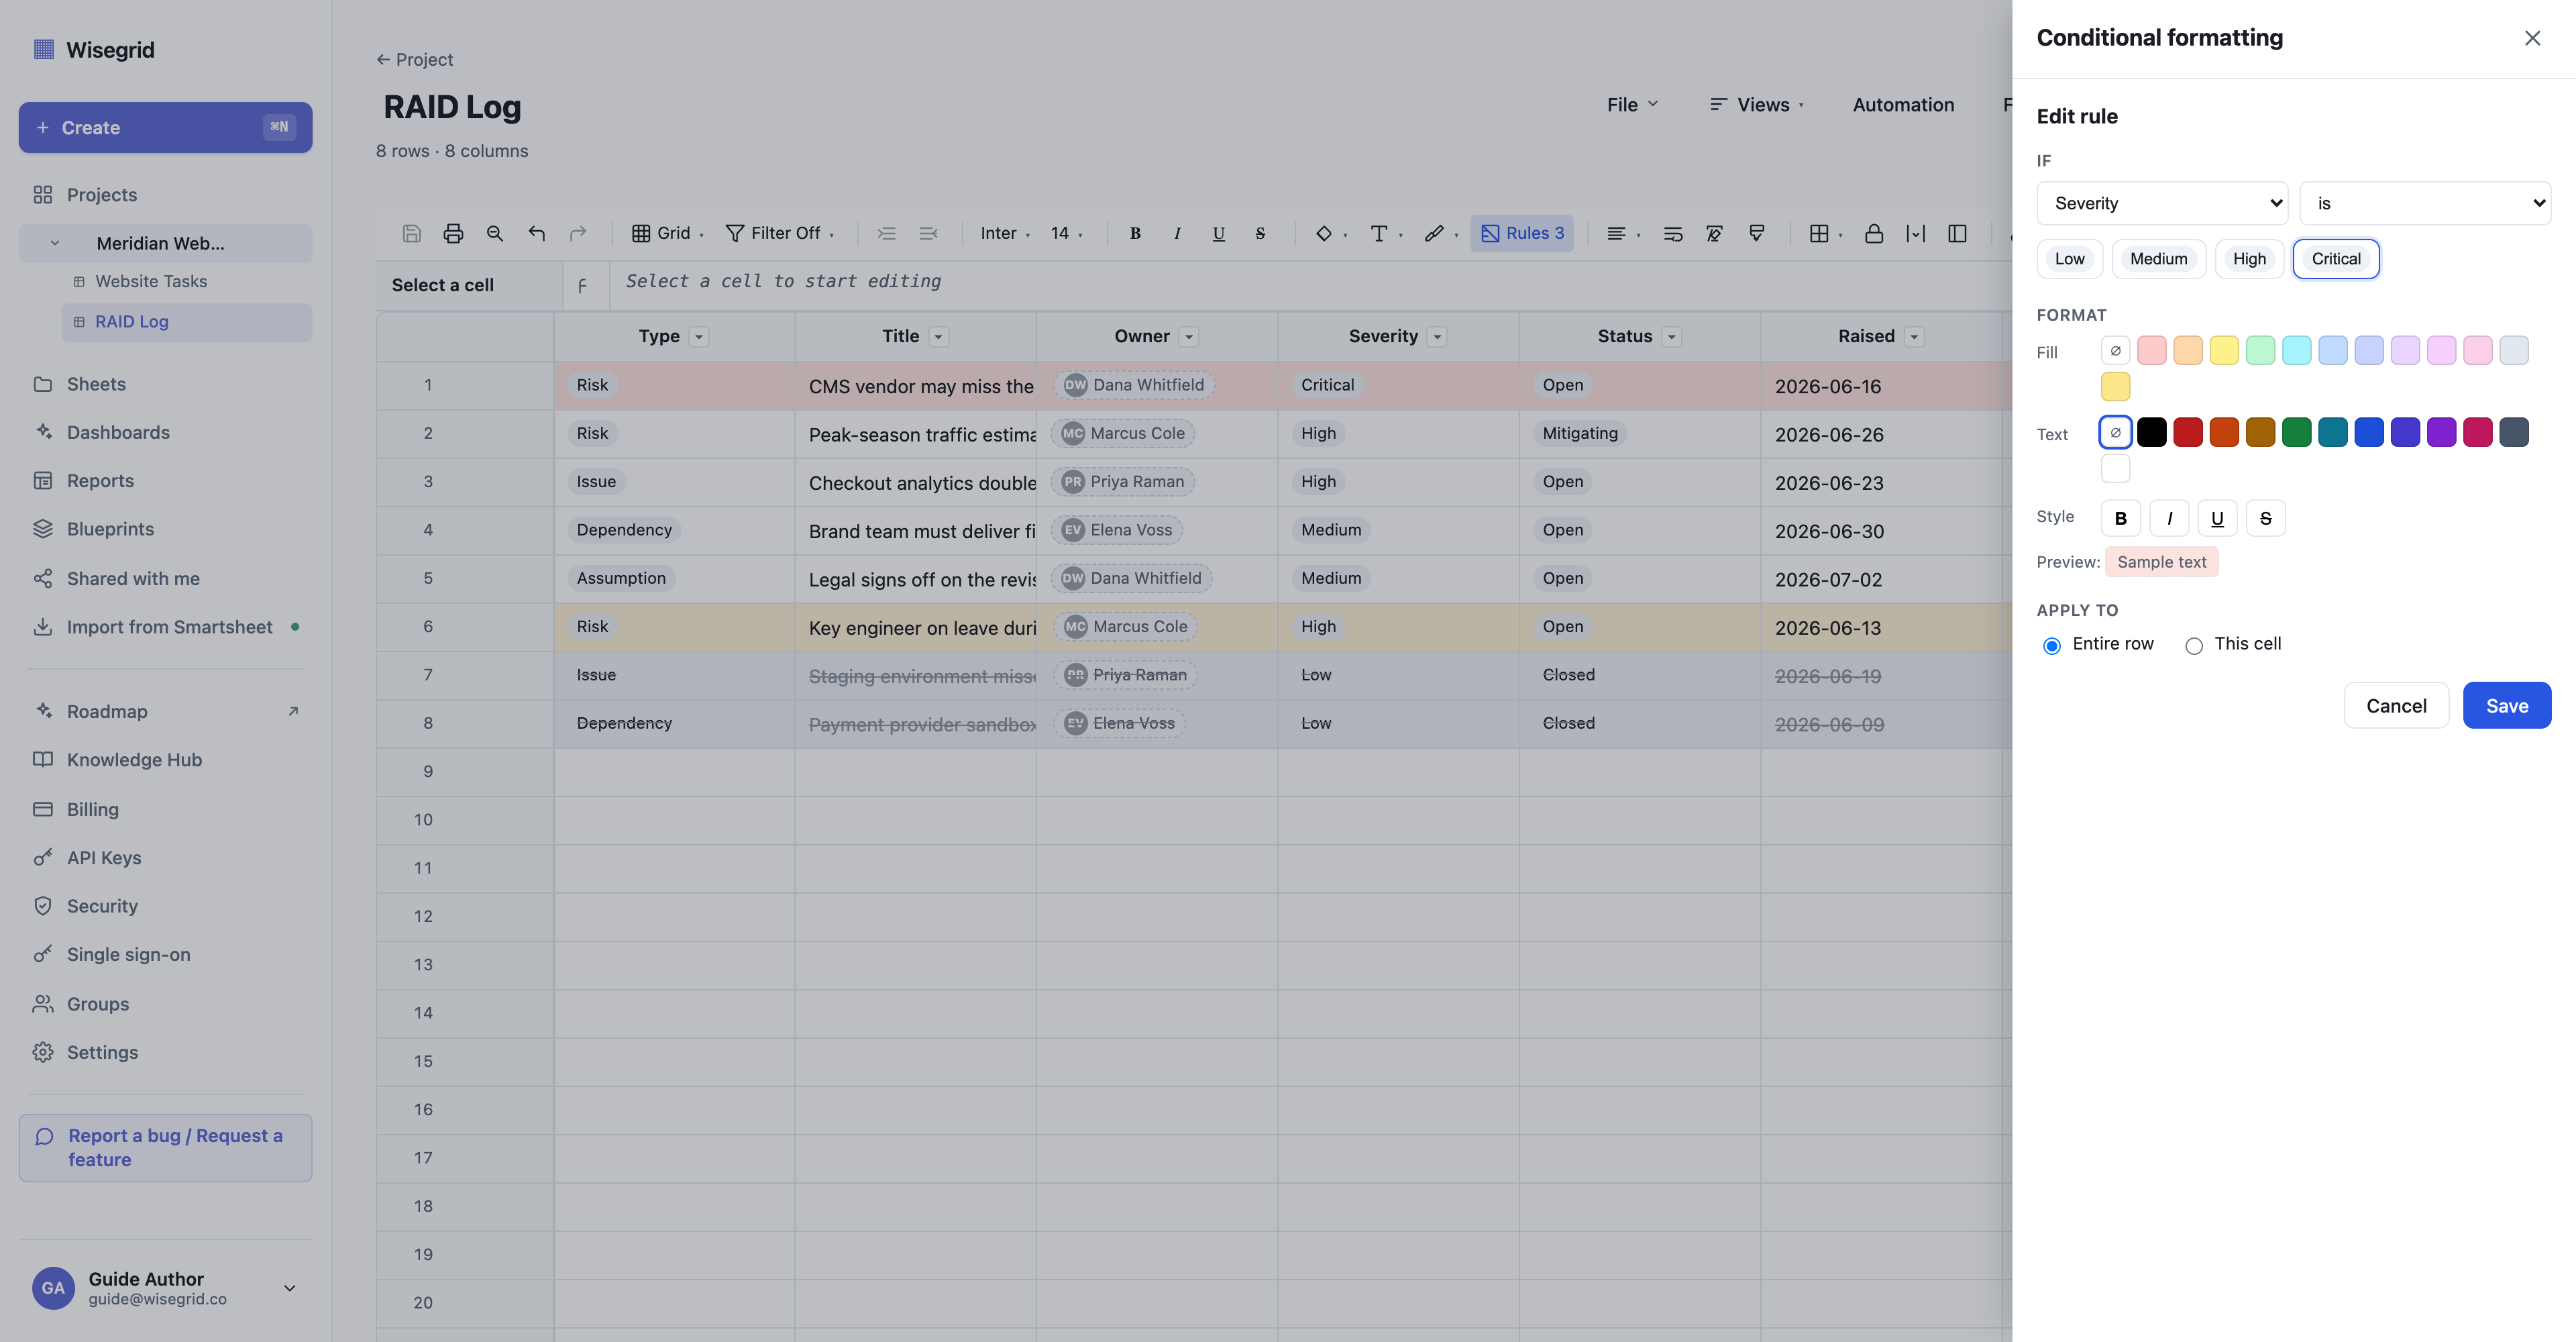
Open the sheet toolbar and click Conditional formatting. Rules are evaluated top to bottom and rules lower in the list win, so put the broad rule first and the sharp exceptions after it:
Ageisred, format the whole row with an amber background. Anything untouched for two weeks becomes impossible to skim past.SeverityisCritical, format the whole row with a red background. Put this below the age rule so a critical entry stays red even when it is also old.StatusisClosed, a grey background with grey strikethrough text on the whole row. Closed entries fade back instead of cluttering the picture, and because this rule sits last, it wins over the age and severity rules for anything already resolved.
Each rule is just three choices (a column, a condition, a format) plus a scope: paint the whole row or only the tested cell. A sheet can carry up to 25 rules, and you can disable a rule with its toggle instead of deleting it.
Add an automation that catches stale items
Colors only help people who open the sheet. The automation is what makes the log chase people instead.
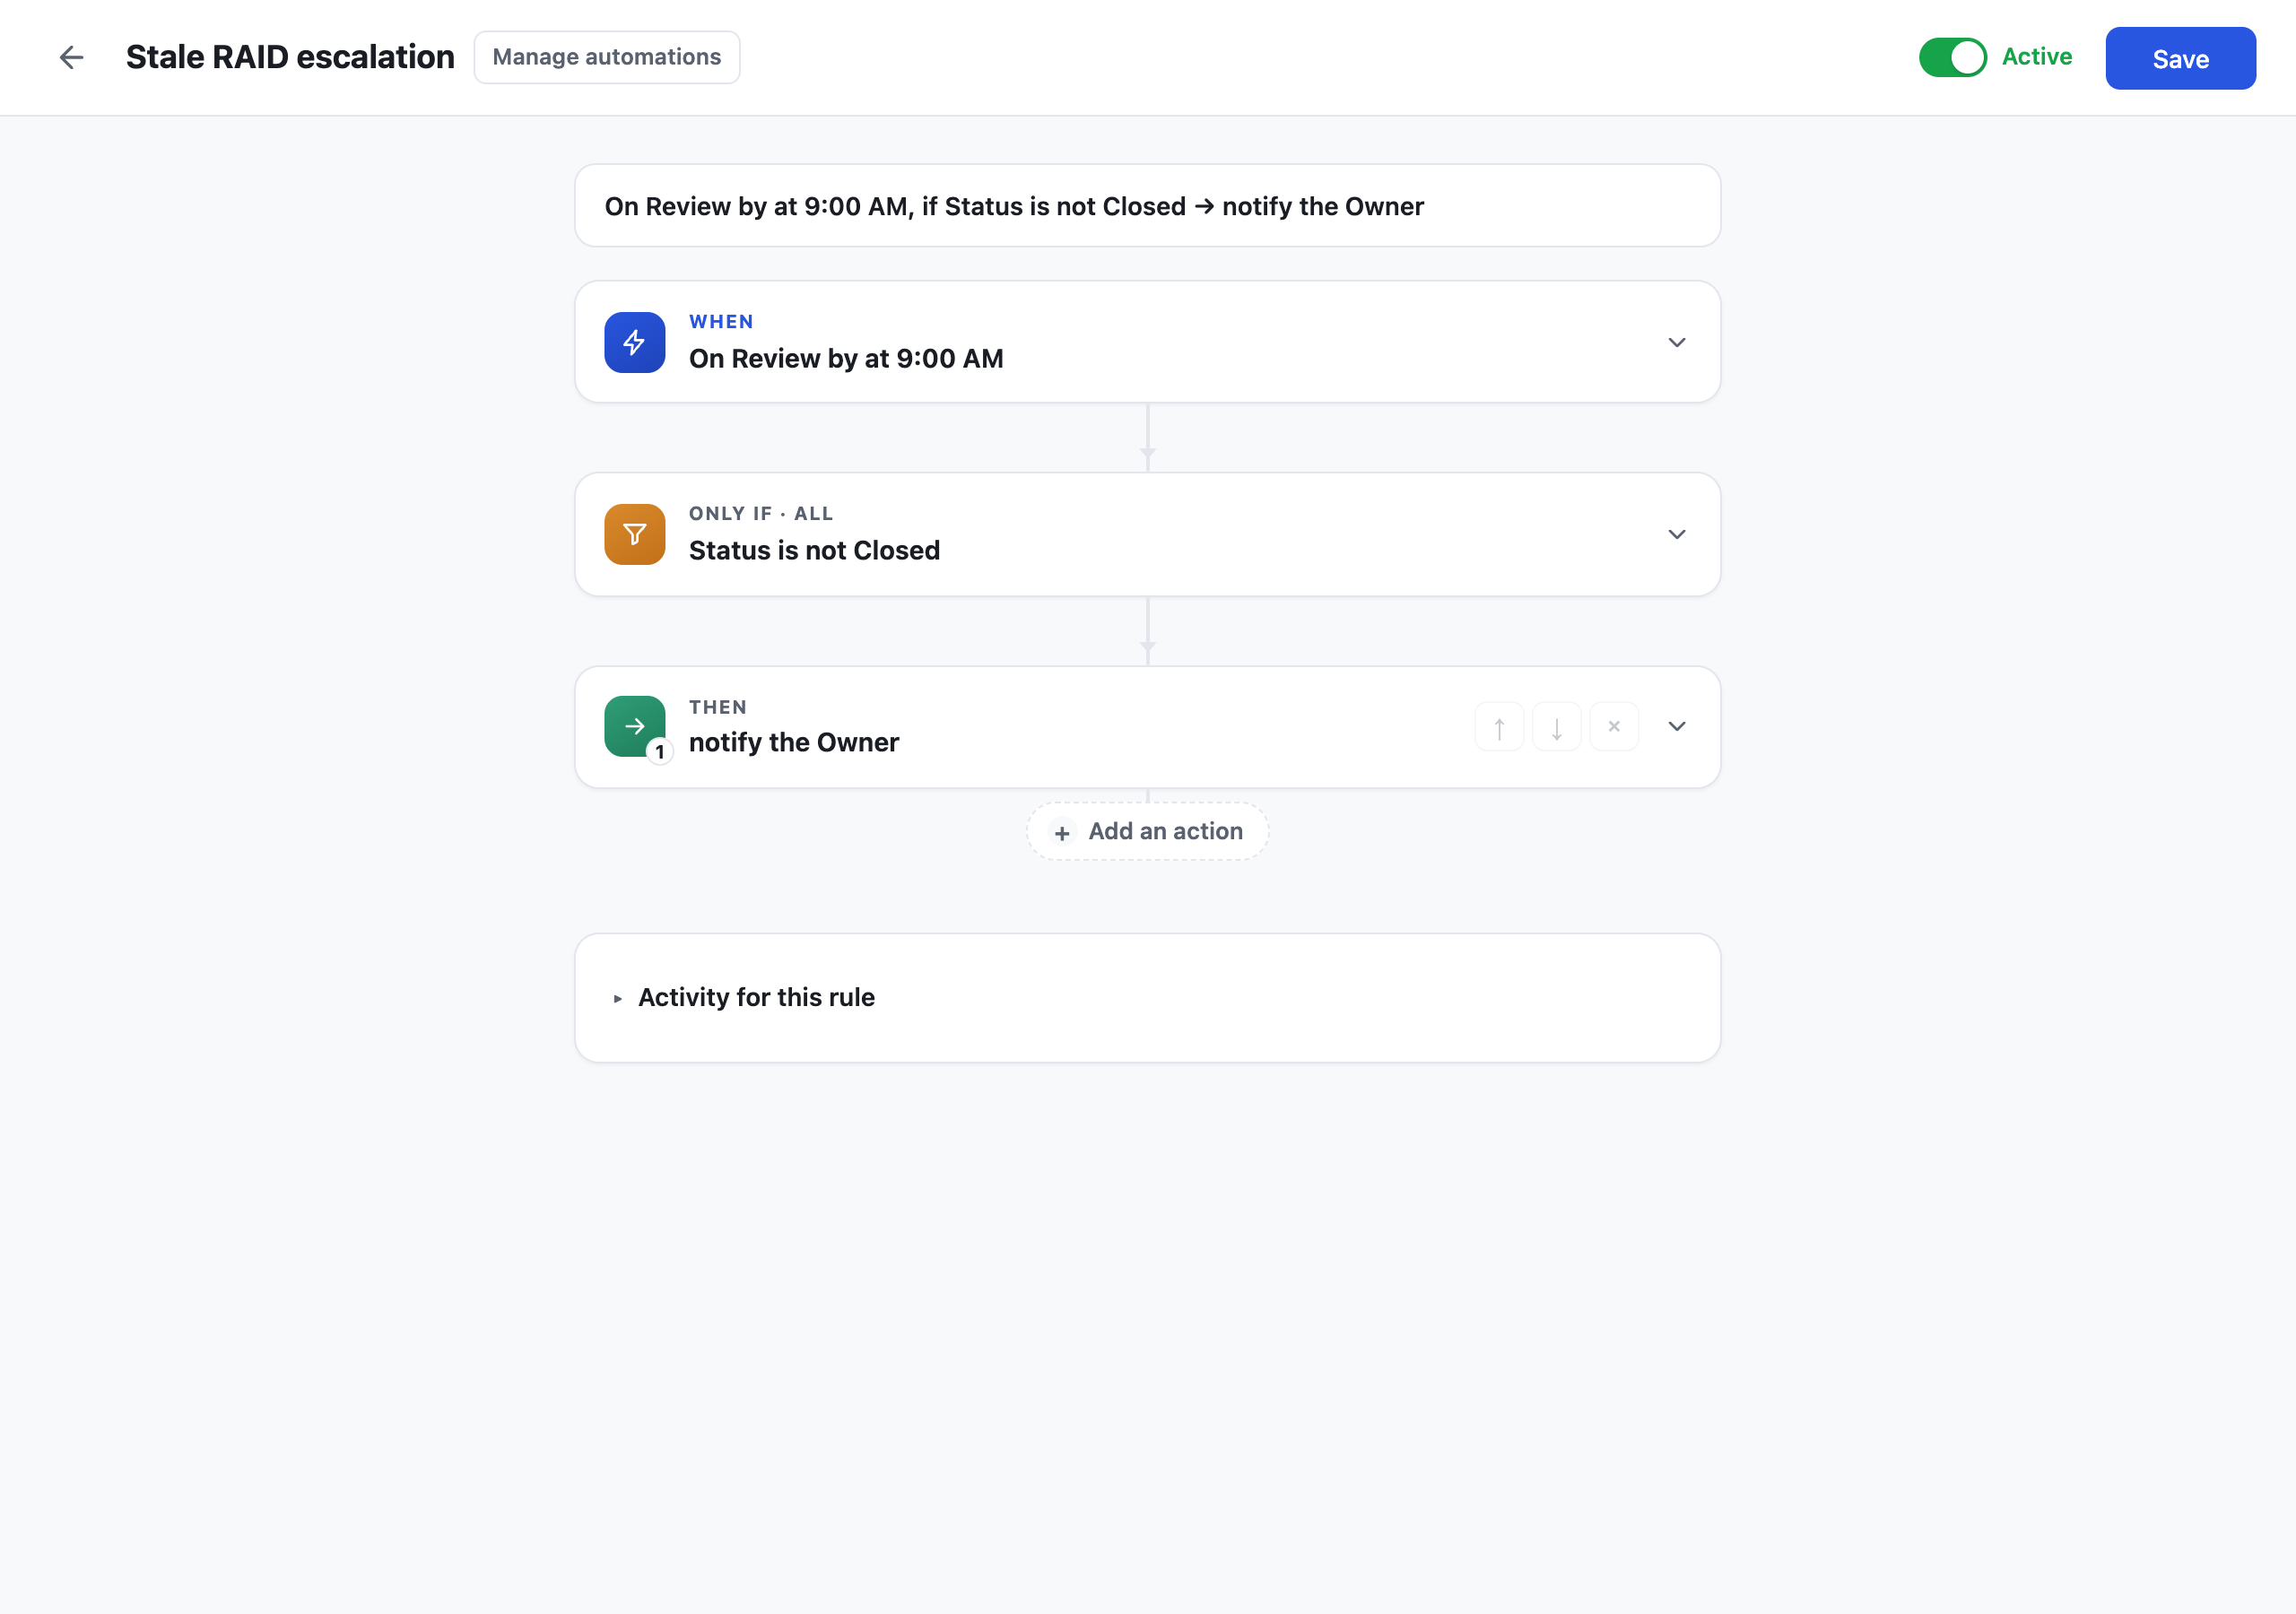
Open Automation from the sheet menu and create a rule. It reads as one sentence, top to bottom:
- When: On a date, days set to
0, so the trigger reads onReview byat 9:00 AM. - Only if:
Statusis notClosed. - Then: Alert someone, and point the recipient at the
Ownercontact column, so the notification goes to whoever owns that specific row.
That is the whole loop: any entry that reaches its review date while still open emails its owner, automatically, at most one nag per review date. You can stack more actions on the same rule (up to 10), for example Change a cell value to flip a checkbox column for triage, or Record a date to stamp when the escalation fired.
Automations run after a change is safely saved and their run history is visible per rule, so you can always see when the rule last fired and on which rows.
Automations are included in your plan. There is no separate workflow tier.
Roll it up on a dashboard
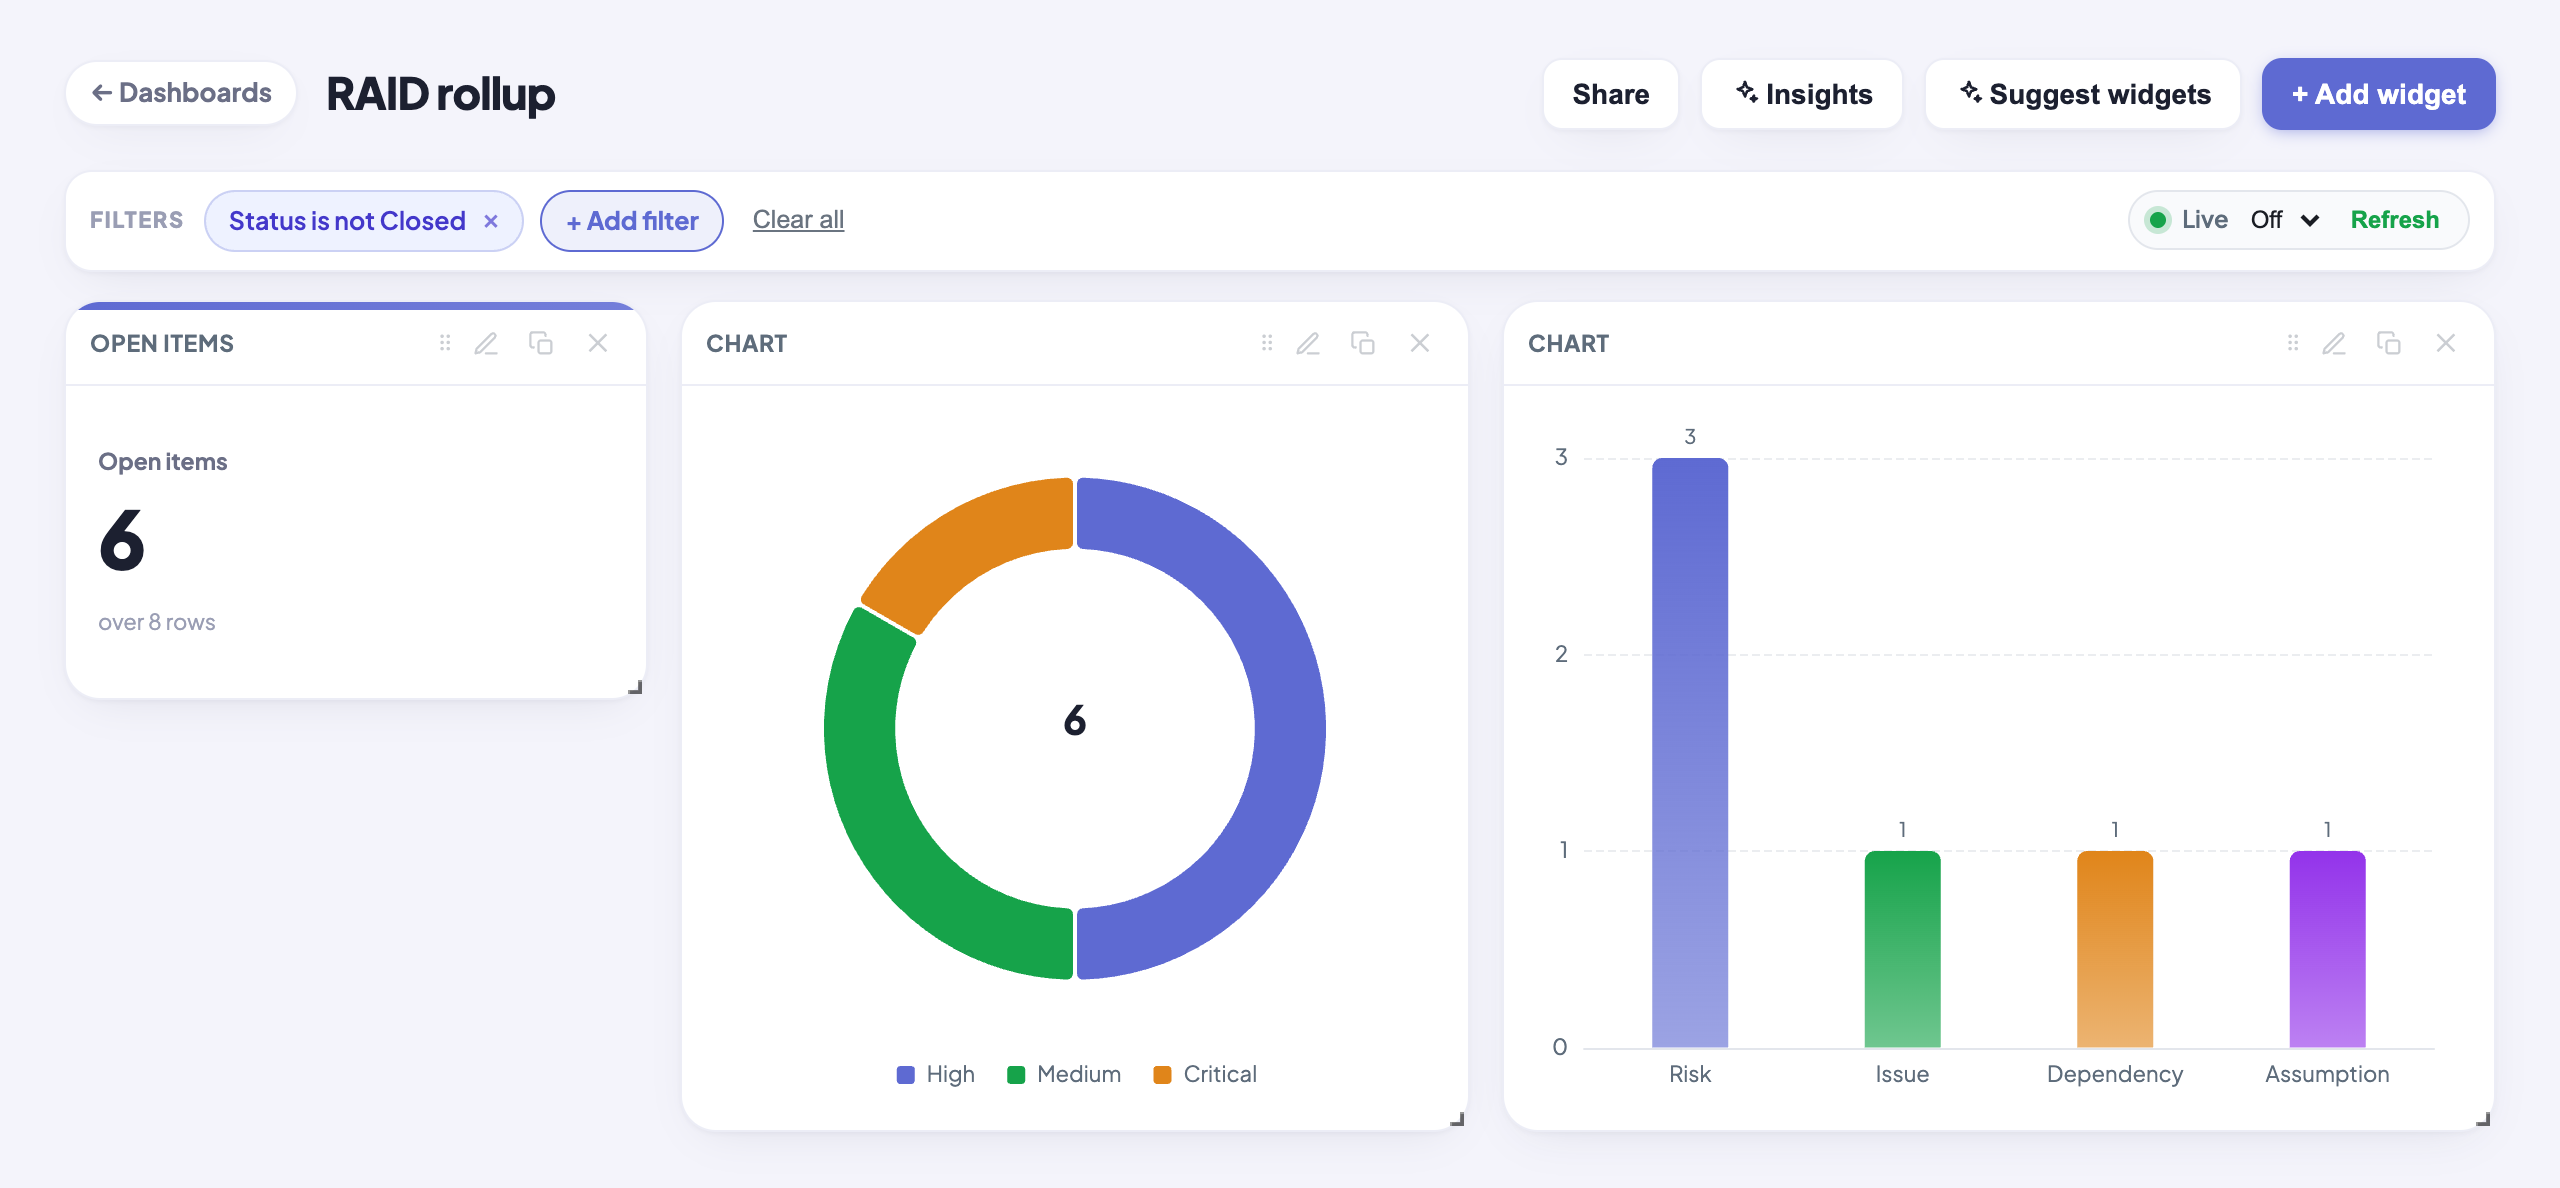
Finally, put the log's vital signs where your stakeholders already look. Create a dashboard, click + Add widget, choose Visualize data, and point the guided builder at the RAID sheet:
- A Metric card with COUNT gives you the headline number. Title it for what it will show once the filter chip below is on, for example "Open items": the card counts whatever the dashboard filter lets through.
- A Chart with COUNT grouped by
Severity(a donut or bar works well) shows the shape of your exposure at a glance. - A second chart grouped by
Typesplits risks from issues from dependencies.
Then use the dashboard's Filters bar to add a Status is not Closed chip (the same "still open" test the automation uses): it narrows every widget on the canvas at once, so the whole dashboard reads "open items only", exactly as in the figure below. Widgets are computed live on the server, and an open dashboard updates itself when the sheet changes, so this is a living rollup, not a weekly export.
What you end up with
- One typed sheet that captures Risks, Assumptions, Issues, and Dependencies with an owner, severity, status, and dates on every entry.
- An Age flag that recomputes itself daily, and formatting rules that make old, critical, and closed entries visually unmistakable.
- An automation that emails each entry's owner the day it comes up for review and is still open. The log does the chasing.
- A live dashboard with the open count and severity breakdown, updating itself as the sheet changes.
Total build time is around 15 minutes, and every capability used here (typed columns, formulas, conditional formatting, automations, dashboards) is included in your plan. If your RAID log lives in Smartsheet today, the importer brings the sheet and its conditional formatting across.
Build it on your own data.
Start your 7-day free trial, or migrate your Smartsheet workspace with one token.